
Figure 5.
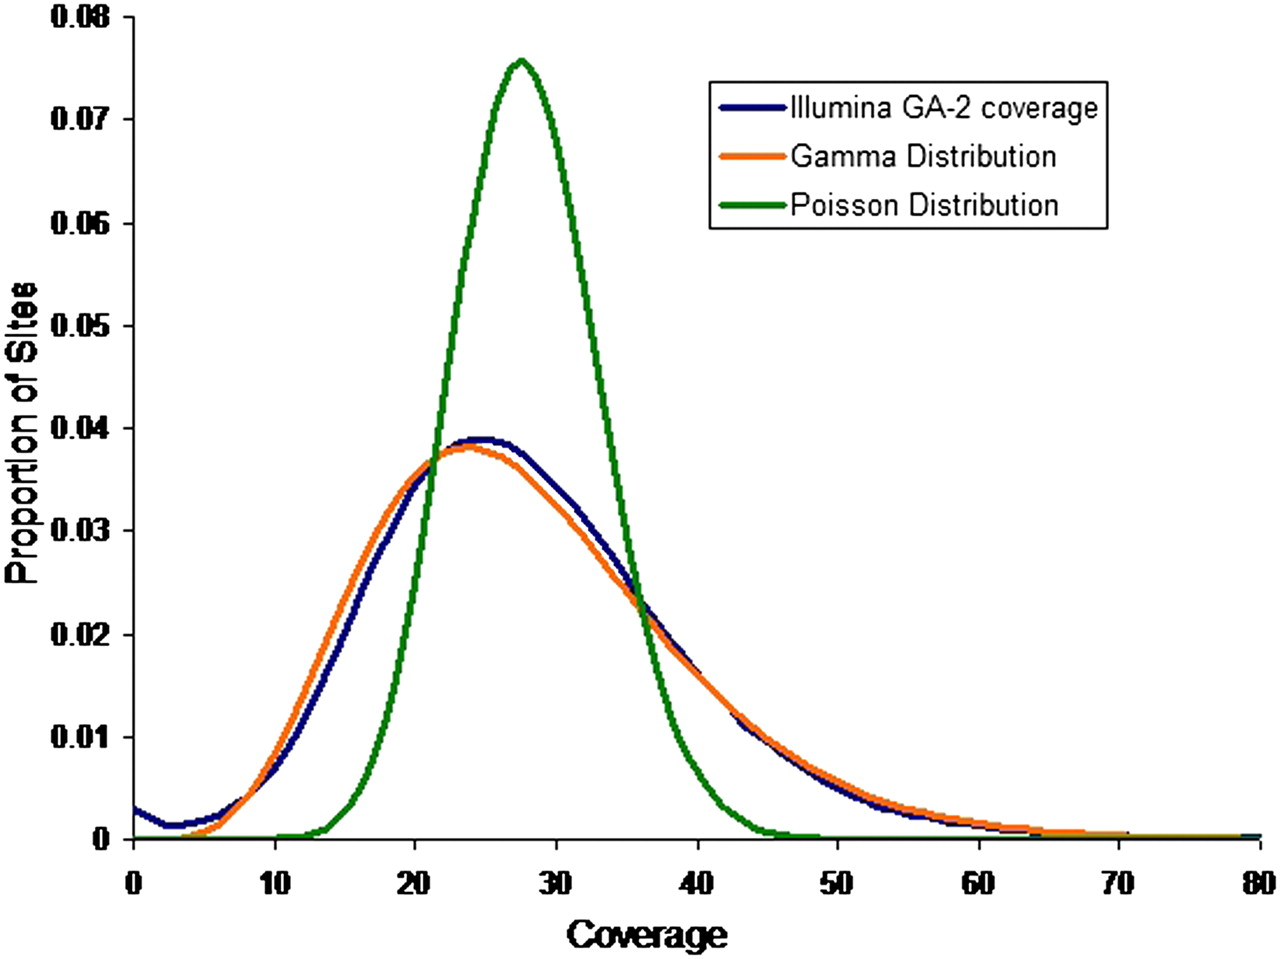
Observed distribution of coverage of Illumina's Genome Analyzer-2 with a mean coverage
 over a 4-Mbp region of C. elegans. The distribution best fits a Gamma distribution Γ(α,β) with shape parameters α = 6.3 and
 . A Poisson distribution is also shown in the figure to compare fits. These results have also been reported by the authors
in Sarin et al. (2008).
. A Poisson distribution is also shown in the figure to compare fits. These results have also been reported by the authors
in Sarin et al. (2008).


