
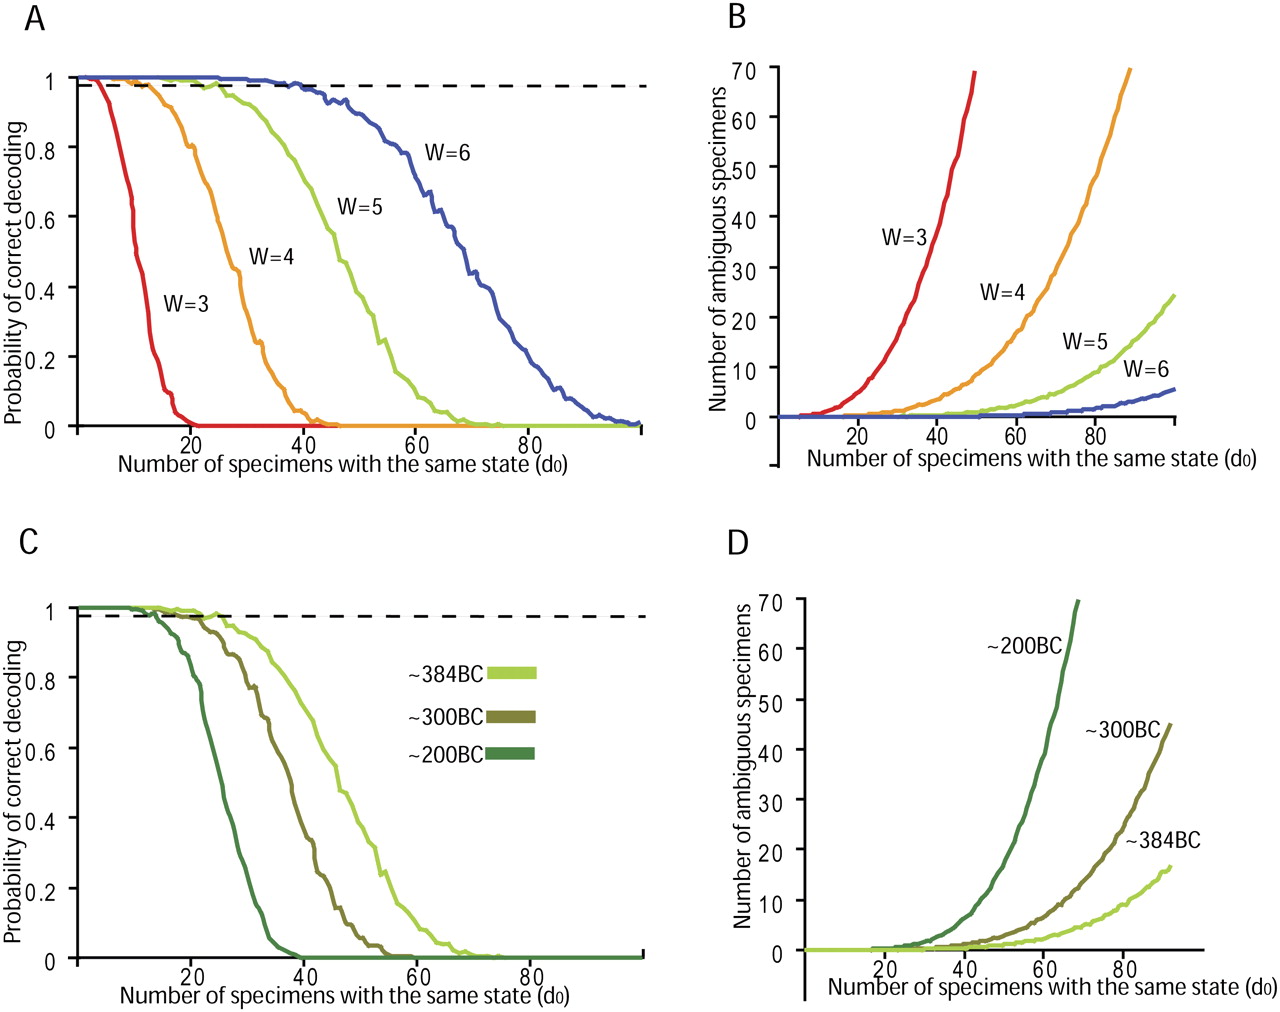
Figure 4.
Simulations of decoder performance in different CRT pooling designs with 40,320 specimens. (A,B) The effect of increasing the weight with 384 barcodes. (C,D) The effect of increasing the number of barcodes with five pooling windows. (A,C) The probability of correct decoding as a function of d0 with different pooling designs. (Gray line) 99%. (B,D) The expected number of ambiguous specimens due to decoding errors as a function of d0 and different pooling designs.


