
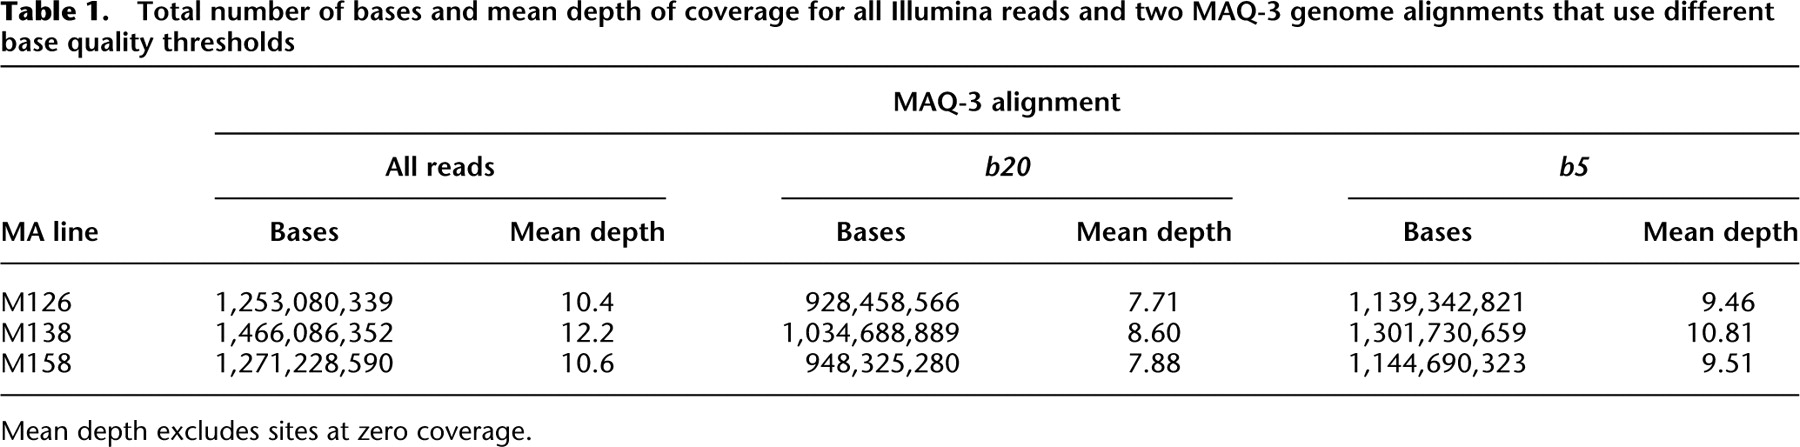
Table 1.
Total number of bases and mean depth of coverage for all Illumina reads and two MAQ-3 genome alignments that use different base quality thresholds
Click on table to view larger version.
-
Mean depth excludes sites at zero coverage.


