
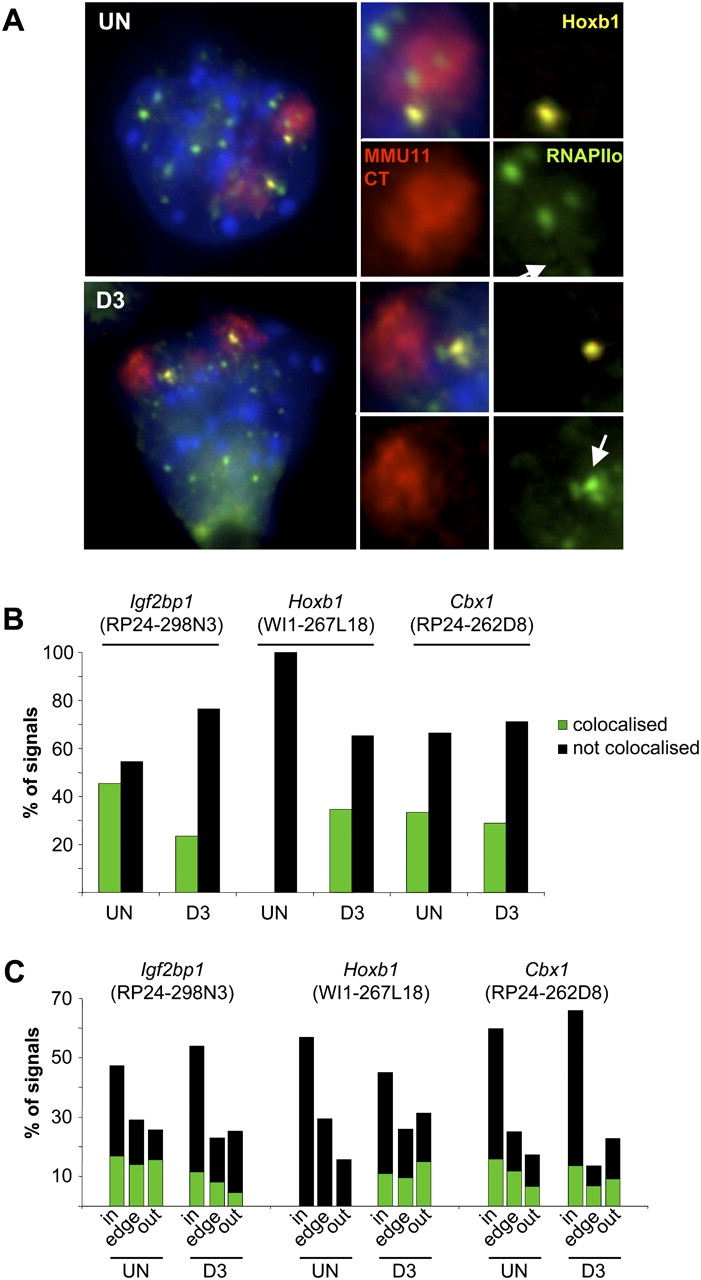
Locus colocalization with foci of RNAPII. (A) Immuno-FISH using an antibody against the phosphorylated form of RNAPII (green), Hoxb1 probe WI1-267L18 (yellow), and MMU11 chromosome paint (red) in undifferentiated ES cells (UN) or cells differentiated for 3 d (D3). The insets to the right show magnified images from one CT with arrows indicating the position of the Hoxb1 locus in the RNAPIIo channel. (B) Histogram showing the percent of signals either colocalized with (dark green) or distinct from (not colocalized; black) phosphorylated RNAPII foci for the regions encompassing Igf2bp1 (BAC RP24-298N3), Hoxb1 (fosmid WI1-267L18) or Cbx1 (BAC RP24-262D8) in undifferentiated (UN) or differentiated cells (D3). (C) Histogram of the nuclear distribution of signals in A with respect to their CT edge. n = 341 (Un), 89 (D3) for Igf2bp1; 62 (Un), 73 (D3) for Hoxb1; and 200 (Un), 90 (D3) for Cbx1.


