
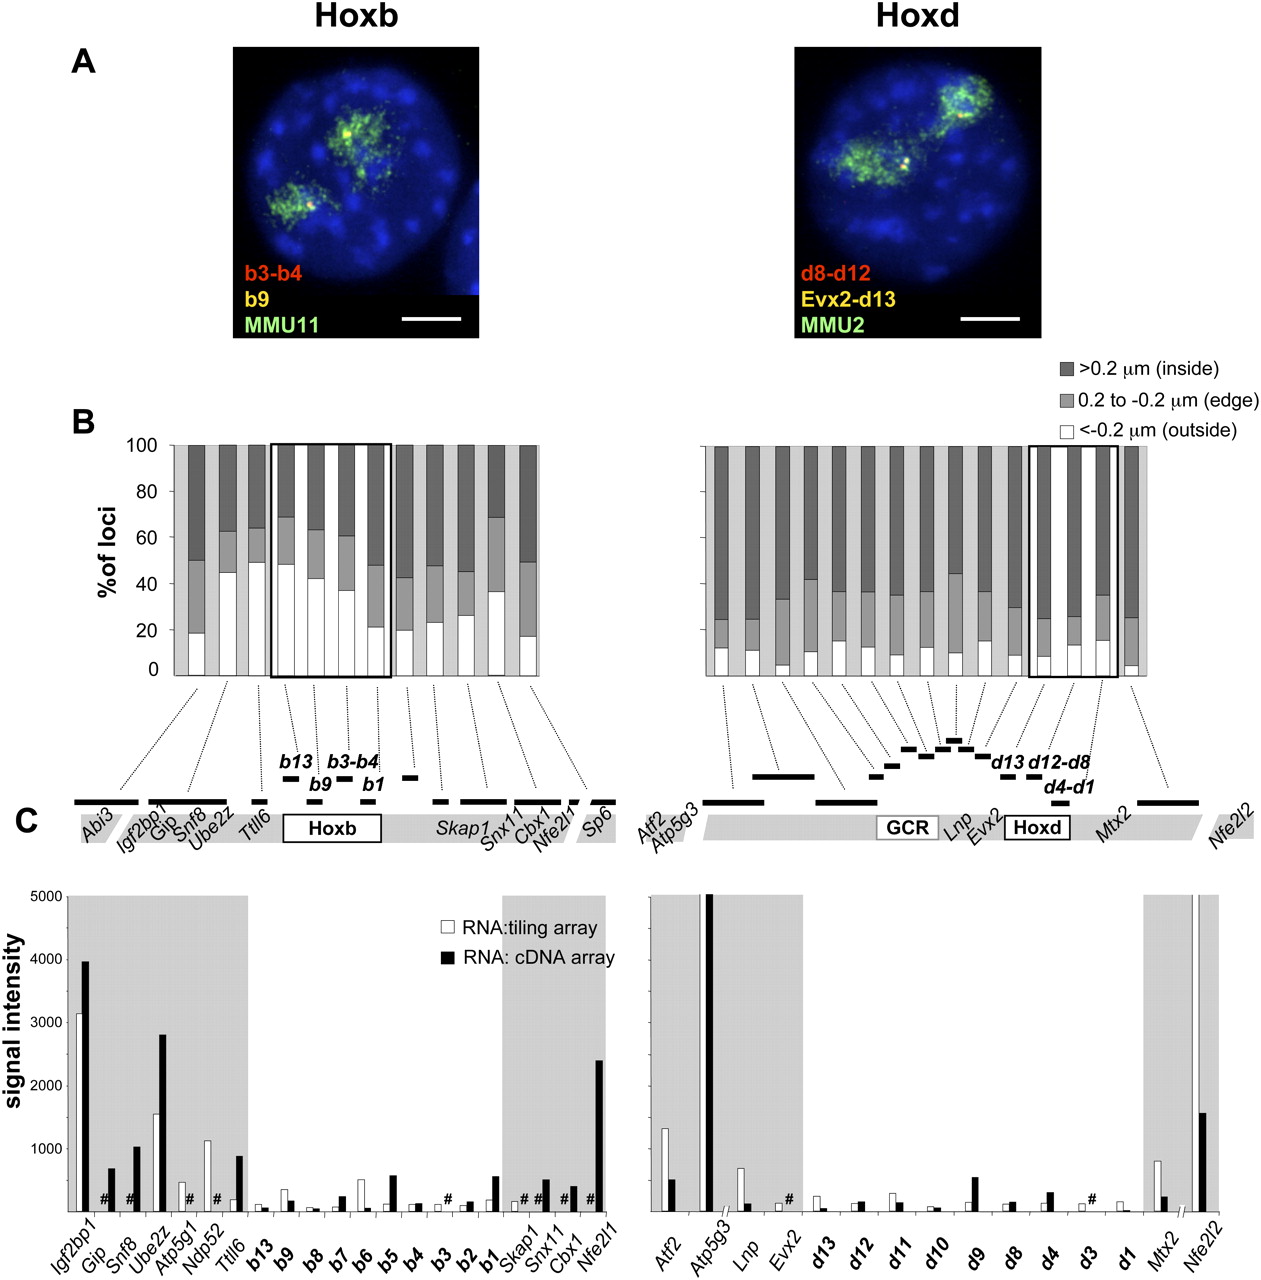
Nuclear organization and gene expression at Hoxb and Hoxd in undifferentiated ES cells. (A) Four-color DNA-FISH on DAPI counterstained nuclei from undifferentiated OS25 ES cells using; (left panel) fosmid probes WI1-1800F8 (b3-b4, red), WI1-934C18 (b9, yellow), and an MMU11 chromosome paint (green) and (right panel) fosmid probes WI1-860J8 (d8-d12, red), WI1-469P2 (Evx2-d13, yellow), and an MMU2 chromosome paint (green). Bar, 5 μm. (B) Percentage of Hoxb or Hoxd region signals located either inside (>0.2 μm; dark gray bars), at the edge (±0.2 μm; light gray bars) or outside (<−0.2 μm; white bars) of the respective CT edge. The location of the probes is depicted on the map underneath the histograms. A minimum of 50 nuclei/100 territories was analyzed. (C) Intensities of signals of cDNA from undifferentiated OS25 ES cells hybridized on a tiling microarray (white columns) or on a cDNA microarray (black columns). Combined results from three independent experiments, including a dye swap, are shown. A sharp sign indicates genes not represented on the respective array.


