
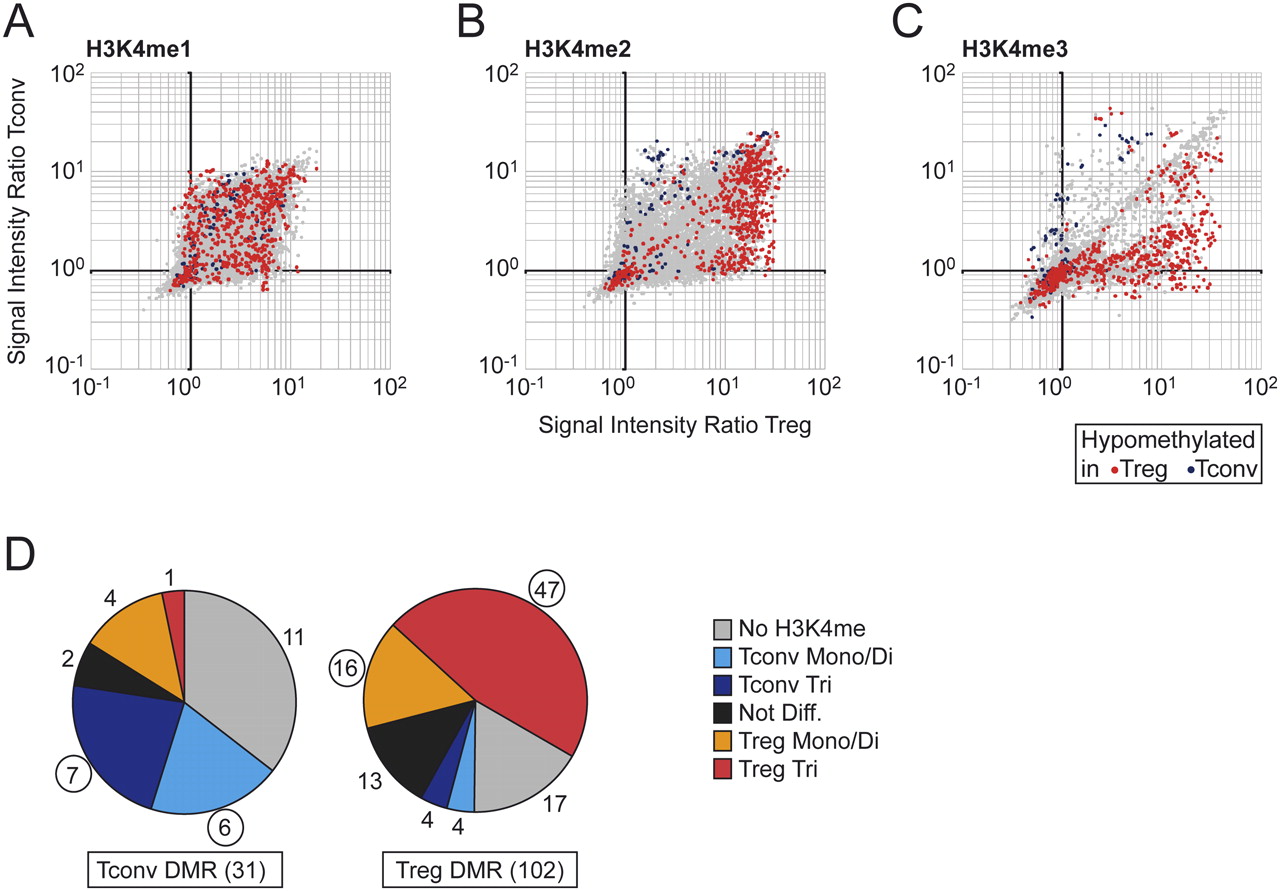
Correlation of DNA demethylation and H3K4 methylation status. (A–C) Probe signal ratios of Tconv and Treg cells are plotted against each other for ChIP-chip experiments of monomethylated (A), dimethylated (B), and trimethylated (C) lysine 4 of histone H3. Probes that appear along the diagonal indicate similar H3K4 methylation levels, whereas probes above or below the diagonal indicate higher methylation levels in Tconv or Treg cells, respectively. Probes in DMRs: (blue) unmethylated in Tconv; (red) unmethylated in Treg; (gray) all other probes. (D) The two pie charts illustrate the relationship of associated H3K4 methylation and DMRs hypomethylated in Tconv (left) or Treg (right). The H3K4 methylation status was classified as follows: DMRs with increased H3K4 trimethylation in Treg or Tconv cells (Treg Tri or Tconv Tri, respectively); DMRs with increased H3K4 mono- or dimethylation, but no trimethylation, in Treg or Tconv cells (Treg or Tconv Mono/Di respectively); DMRs with H3K4 methylation present but no difference between T cell subsets (Not diff.); and DMRs with no detectable H3K4 methylation (No H3K4me). The numbers of DMRs in each subclass are shown next to each piece of pie. Circled numbers indicate subclasses where hypomethylation in one cell type correlates with an increased level of H3K4 methylation in the same cell type.


