
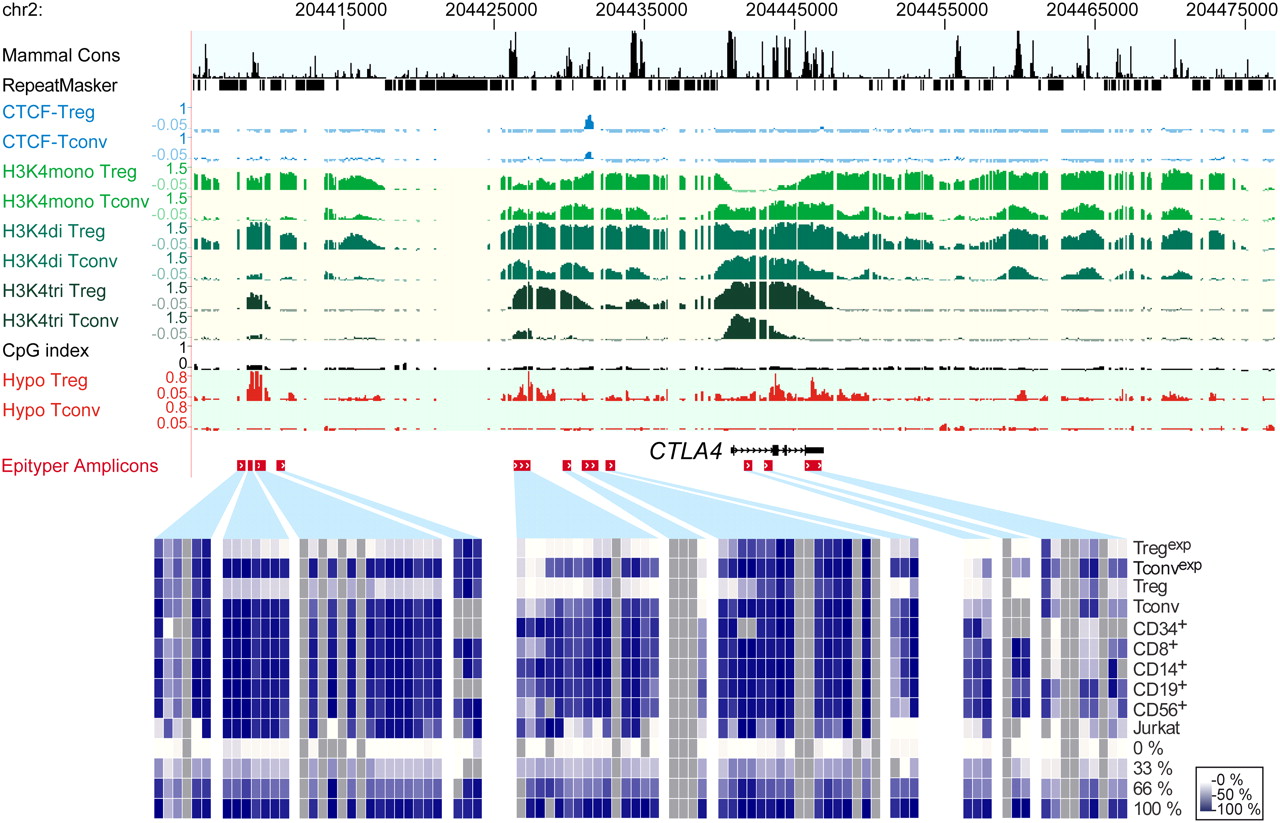
Chromatin modification and CTCF binding patterns across the CTLA4 gene locus. Shown are the following tracks (from top to bottom): mammalian Consensus (Cons, black); repetitive regions as identified by the RepeatMasker program (black); ChIP-chip tracks for CTCF (blue); monomethylated (pale green), dimethylated (green), and trimethylated (dark green) lysine 4 of histone H3; and the CpG index (indicating the methylation density 300 bp up- or downstream of each microarray probe) as well as hypomethylation scores (red) for both cell types. Several amplicons were designed for MALDI-TOF MS analysis of bisulfite-treated DNA as indicated below the tracks. Methylation levels of individual CpGs in the indicated cell types are shown color-coded as described in the Fig. 1 legend.


