
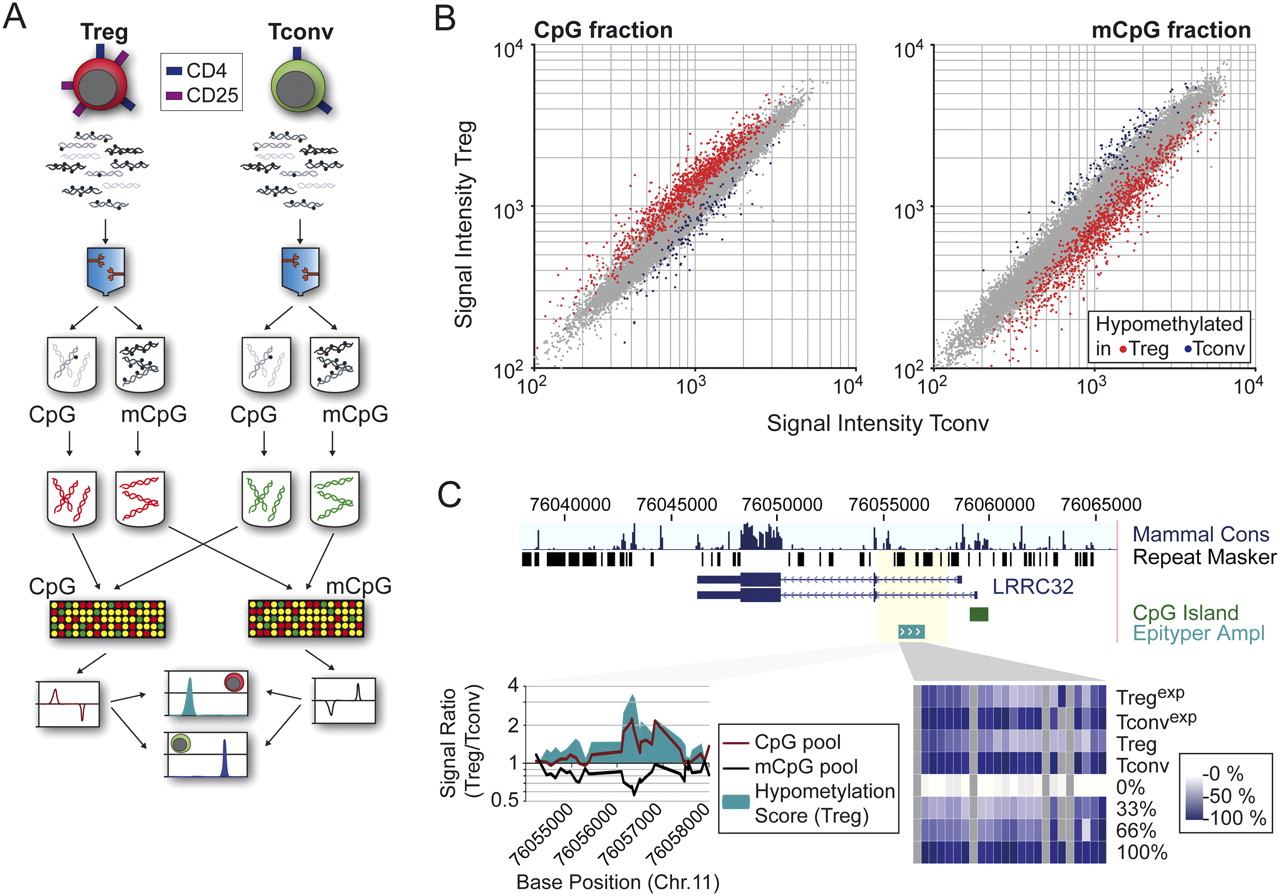
Locus-wide identification of DMRs using the MCIp “mirror image” approach. (A) Schematic outline of the MCIp fragmentation and hybridization strategy. The fragmented genomes of Tconv and Treg cells are separated into unmethylated (CpG) and methylated (mCpG) pools. Each pool is directly labeled using fluorescent dyes, and each pool of one cell type is compared with the corresponding pool of the other cell type on a locus-wide microarray. Microarray images are compared to identify regions that show a reciprocal hybridization behavior. (B) Representative scatter plots of CpG- and mCpG-pool hybridizations are shown. Probes with reciprocal signal intensity ratios indicate the presence of DMRs. (Red) Treg cells; (blue) Tconv cells. (C) Exemplary validation of microarray results using mass spectrometry. The intron 1 region of LRRC32 is enriched in the unmethylated (CpG, red line) and depleted in the methylated (mCpG, black line) pools of Treg cells. A large hypomethylation score (defined as the difference product of log10 signal intensity ratios of both hybridizations) indicates differential methylation (bottom left panel). The same region was analyzed by MALDI-TOF MS (Epityper), and results are shown as a heat map (the scale ranges from white [no methylation] to dark blue [100% methylation]).


