
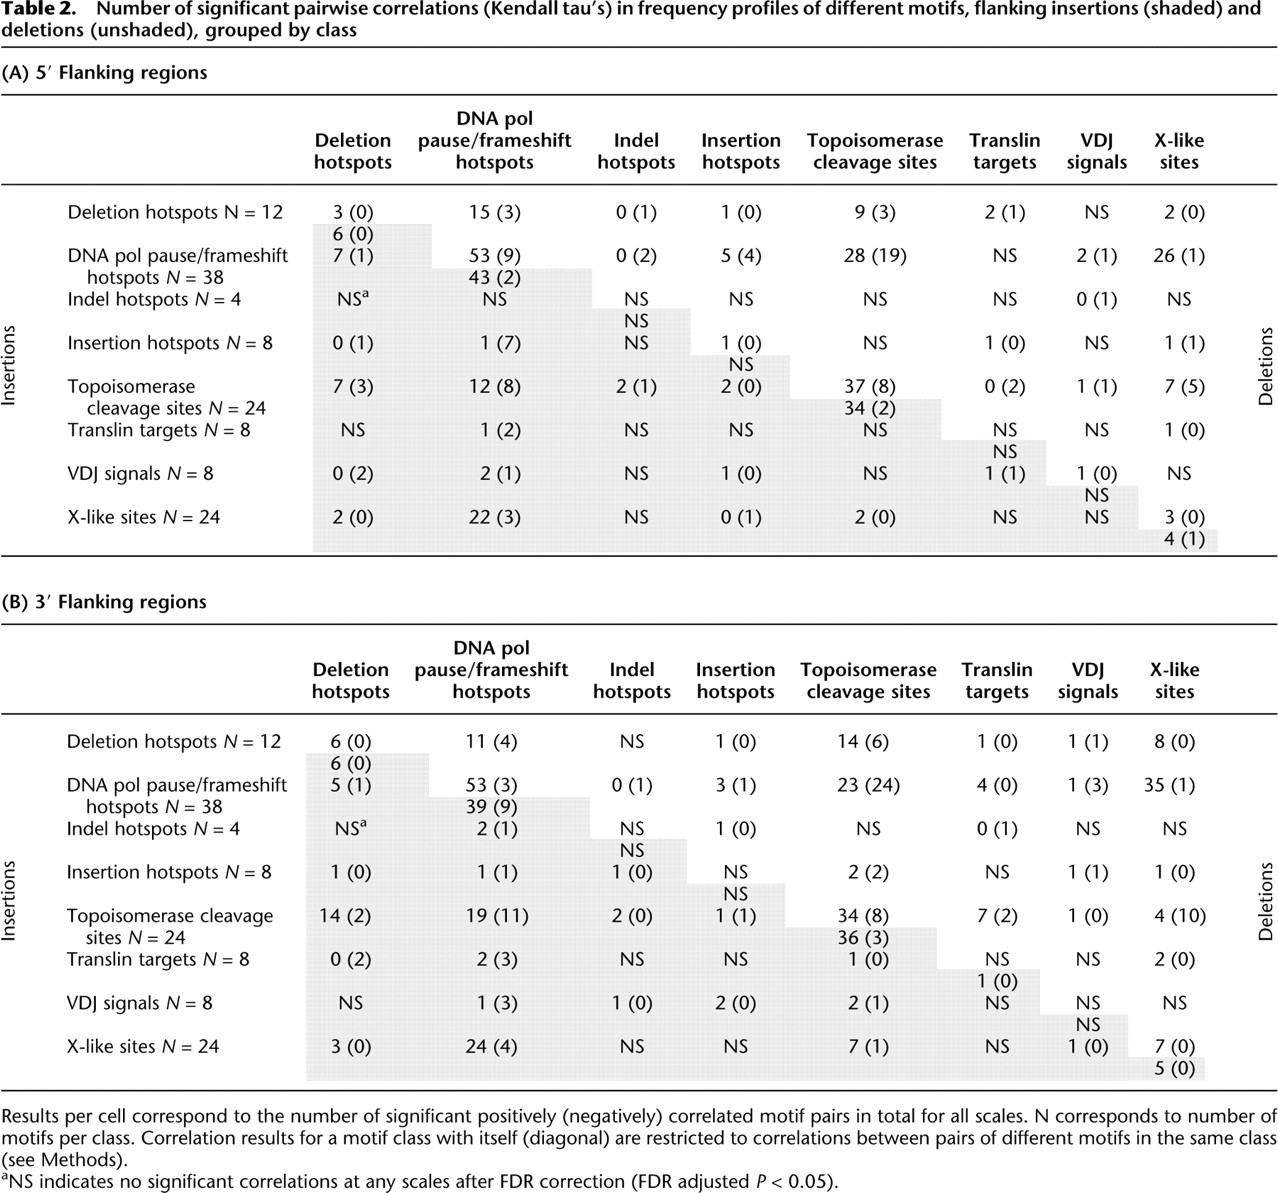
Number of significant pairwise correlations (Kendall tau's) in frequency profiles of different motifs, flanking insertions (shaded) and deletions (unshaded), grouped by class
Click on table to view larger version.
-
Results per cell correspond to the number of significant positively (negatively) correlated motif pairs in total for all scales. N corresponds to number of motifs per class. Correlation results for a motif class with itself (diagonal) are restricted to correlations between pairs of different motifs in the same class (see Methods).
-
aNS indicates no significant correlations at any scales after FDR correction (FDR adjusted P < 0.05).


