
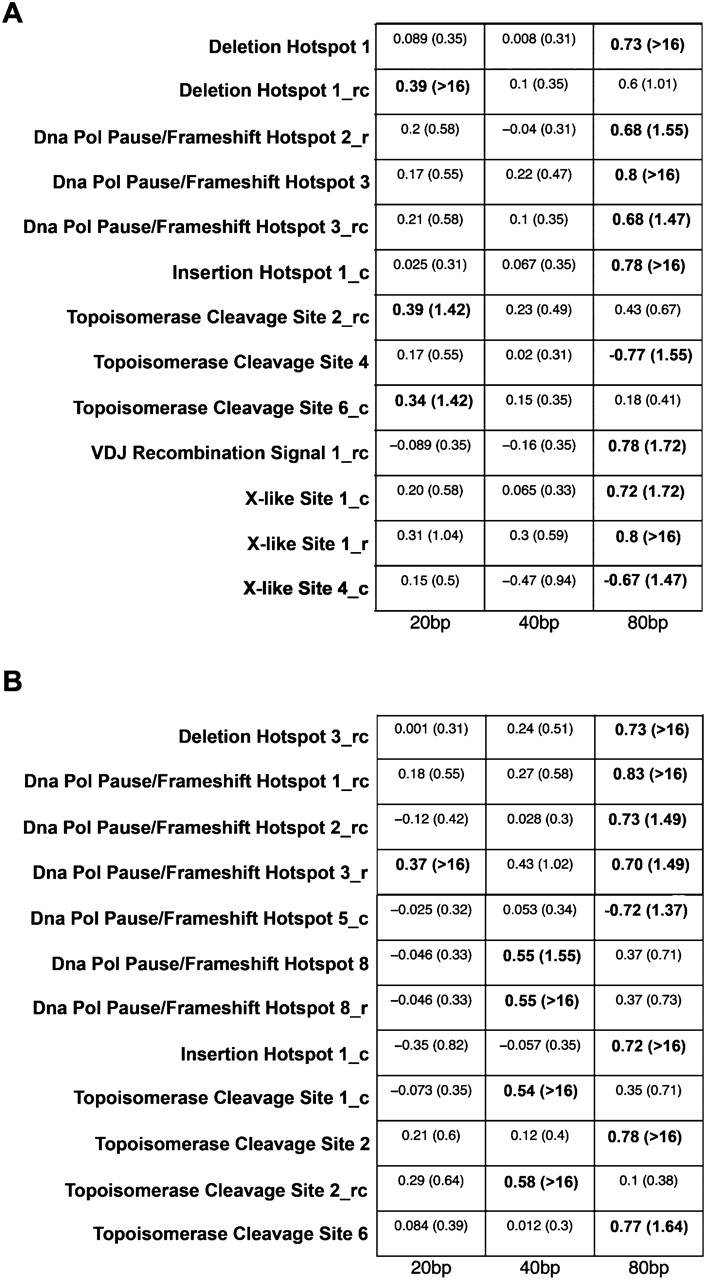
Figure 4.
Significant Kendall tau correlations of total motif frequency profiles around insertions vs. deletions, separately for various scales, and for 5′ (A) and 3′ (B) flanks. Positive and negative correlations are indicated by sign, with bolded cells corresponding to those significant after FDR correction (FDR controlled at 5%; −log10 of adjusted P-values are reported in parentheses, with “>16” signifying a P-value of <10−16). Motif names are given suffixes to indicate reverse (r), complement (c), and reverse complement (rc). Scales below 20 and above 80 bp are not reported because no motifs had significant correlations at such scales after FDR correction.


