
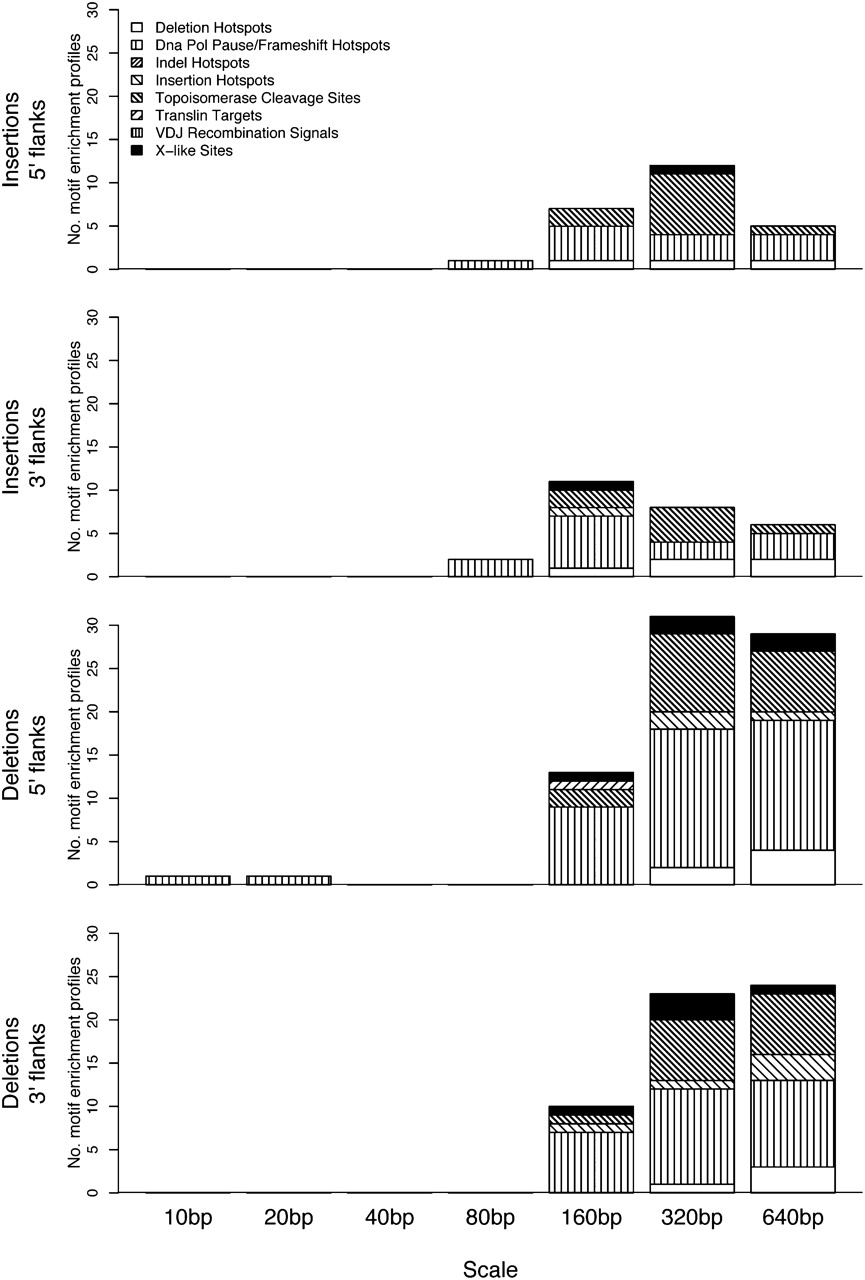
Figure 3.
Distribution of motifs with significant enrichment profiles (wavelet-based) across motif classes (patterned areas) and scales (bars), separately for the 5′ and 3′ flanks of insertions and deletions. Patterned areas are proportional to the number of significant motifs per class (magnitude is measured taking second moments after wavelet transform of each enrichment profile, and significance is assessed through a random permutation scheme, and subject to a FDR correction; FDR controlled at 5%).


