
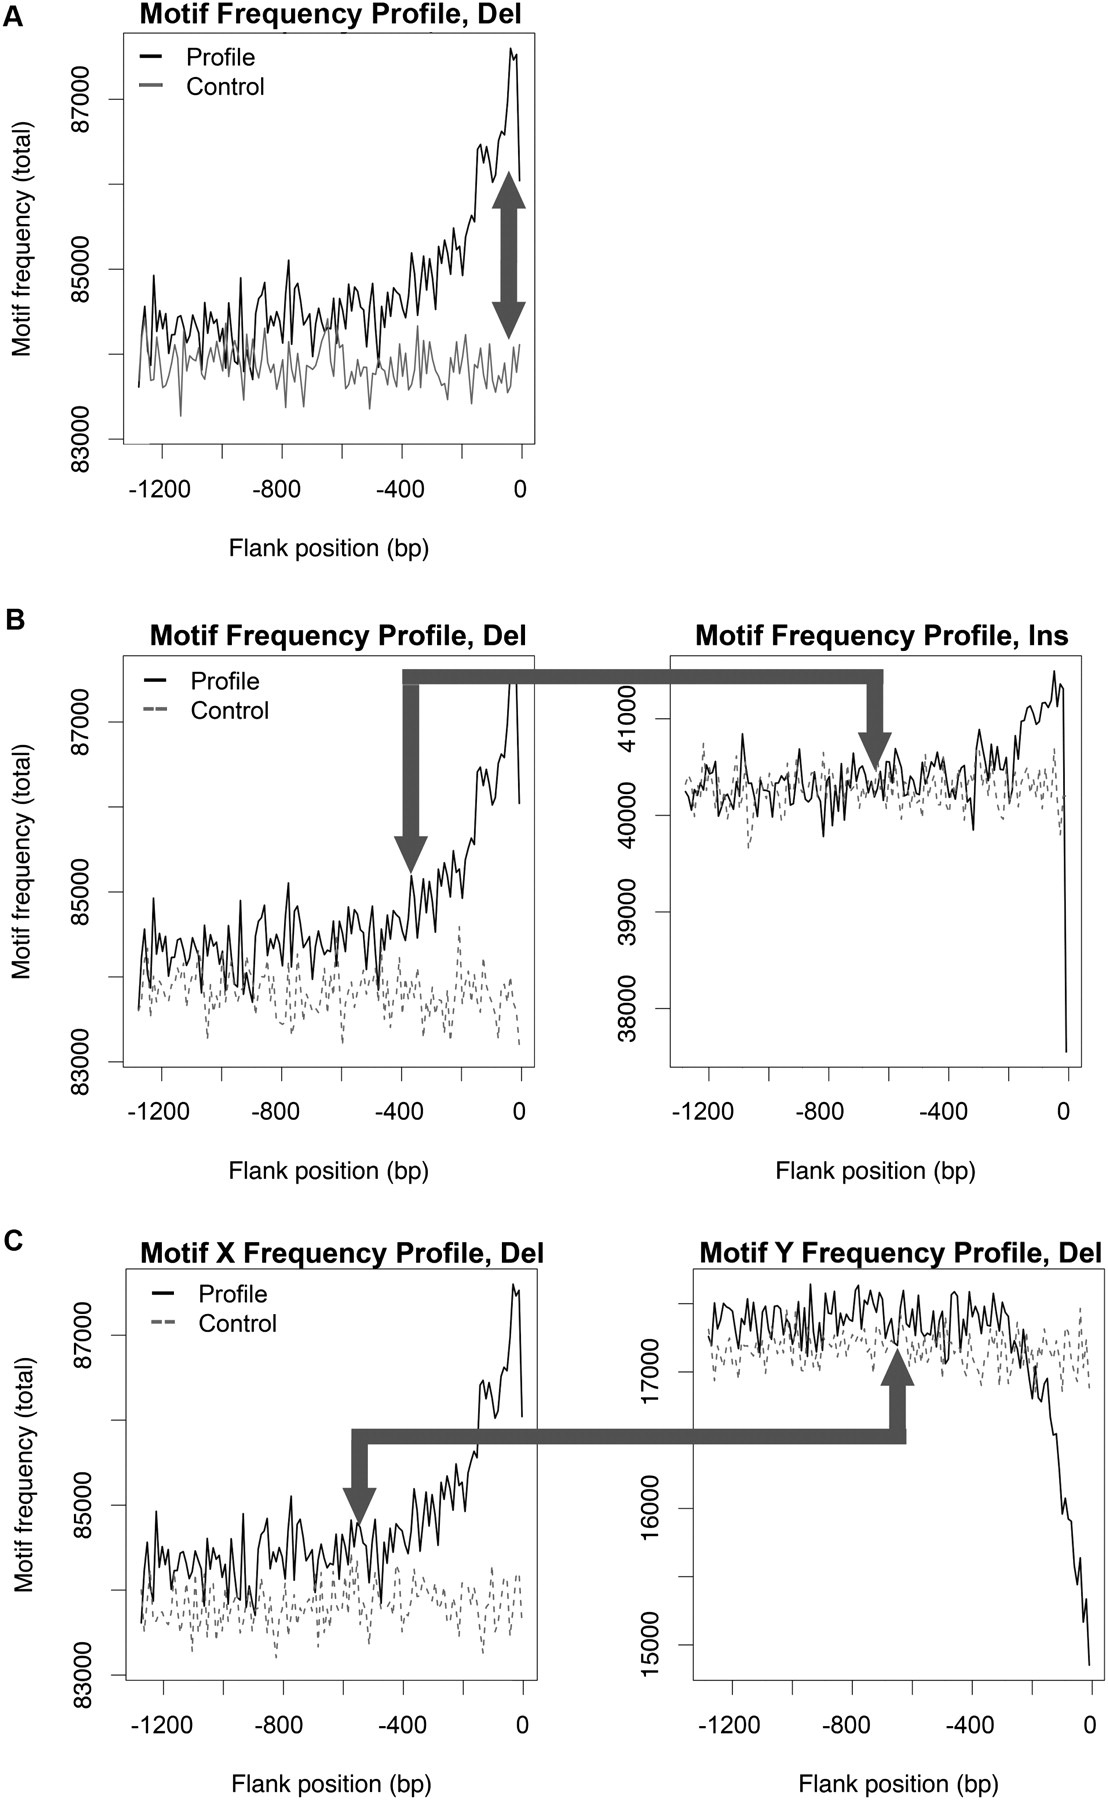
Multiscale wavelet analyses (for details, see text; Supplemental Figs. S2–S4): total frequency profiles illustrating three types of comparisons (arrows) using topoisomerase cleavage site 4 as an example motif. (A) Indel vs. control: enrichment profiles. The spatial occurrence pattern characterizing a motif is investigated forming an enrichment profile, i.e., the difference between the motif's total frequency profile in an indel-related subgenome (e.g., the 5′ flank of deletions; black line) and that in the corresponding control subgenome (gray line). (B) Insertions vs. deletions: similarity between profiles. This is investigated by comparing the motif's total frequency profile in a deletion-related subgenome (e.g., the 5′ flank; black line; left) with that in the corresponding insertion-related subgenome (black line; right). Control profiles (dashed lines) are provided for visual reference only. (C) Motif X vs. motif Y: colocation in profiles. Along with topoisomerase cleavage site 4 (X), here we consider DNA pol pause/frameshift hotspot 1 (Y). Colocation is investigated by comparing the total frequency profiles of X vs. Y in an indel-related subgenome (e.g., the 5′ flank of deletions; black lines for X on the left, and Y on the right). Control profiles (dashed lines) are provided for visual reference only.


