
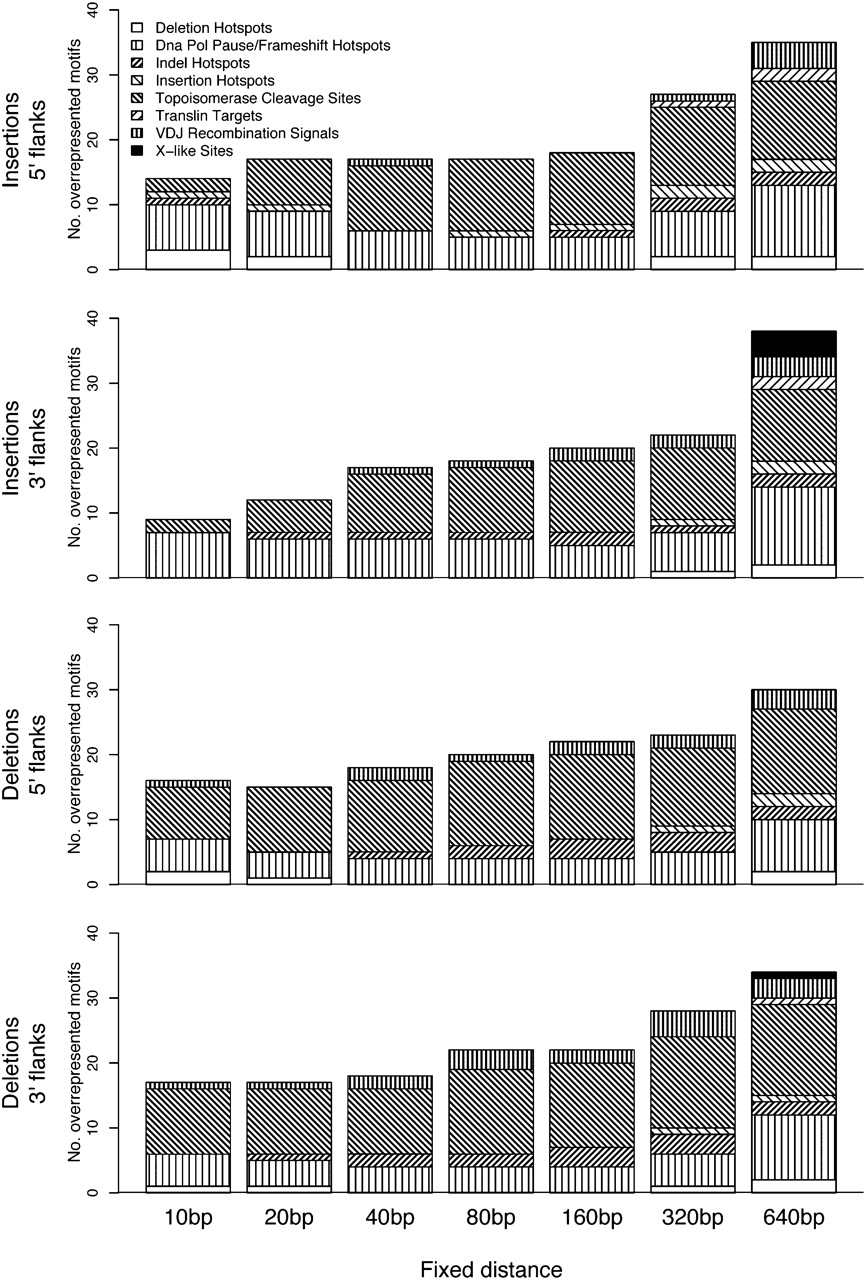
Figure 1.
Distribution of overrepresented motifs (nonwavelet based) across motif classes (patterned areas) and distances from the breakpoint (bars), separately for the 5′ and 3′ flanks of insertions and deletions. Patterned areas are proportional to the number of significant motifs per class (significance is assessed resampling from the control subgenome, and subject to a false discovery rate [FDR] correction; FDR controlled at 5%).


