
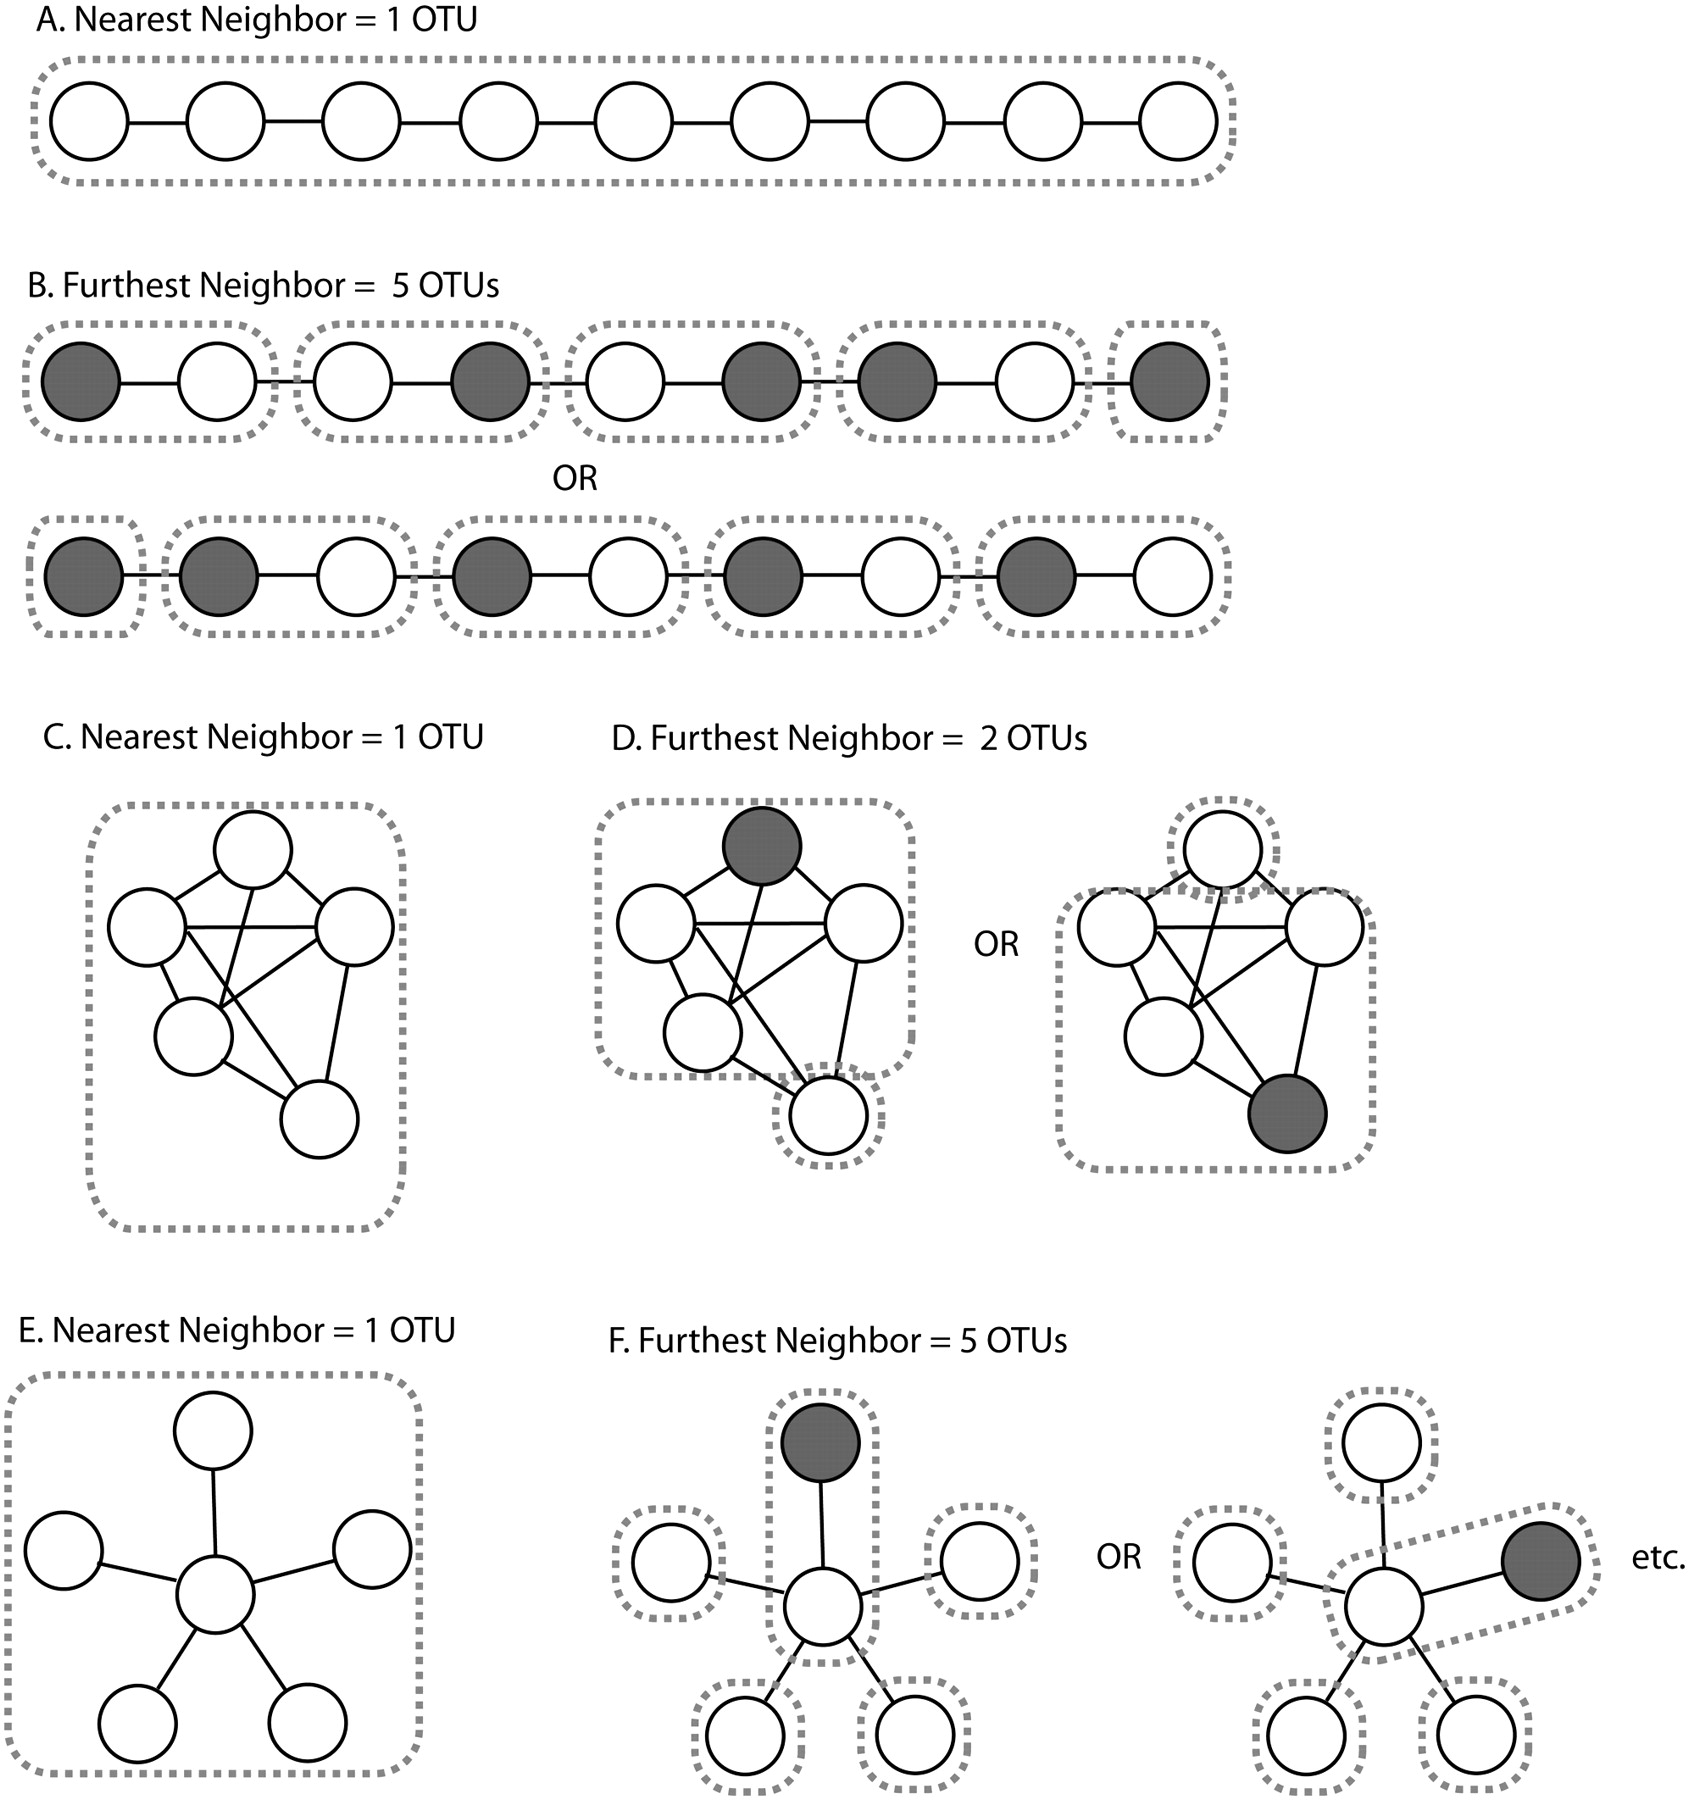
Different methods for selecting OTUs produce different results. (A,B) If sequences are arranged so that each sequence has a neighbor within the OTU threshold (e.g., 97%) but these neighbors are not similar to one another, that is, the variation is not in the same direction, (A) the nearest-neighbor algorithm will produce one OTU because every sequence is connected to every other sequence through a chain of neighbors within threshold, but (B) the furthest-neighbor algorithm will produce a series of OTUs where all members of each OTU are similar to one another. (OTU boundaries are indicated by dashed lines.) Note that the precise OTUs produced by the furthest-neighbor algorithm will vary every time owing to the choice of the randomly chosen seed sequence for each (gray) OTU. (C,D) If sequences are arranged so that there is one outlier that is within threshold of only one of the other sequences, (C) the nearest-neighbor algorithm will produce a single OTU, (D) but the furthest-neighbor algorithm will produce two OTUs in which one of the two most distant sequences is excluded from the main OTU at random. (E,F) If sequences are arranged so that all sequences are within threshold of a central sequence but are outside threshold from each other, (E) the nearest-neighbor algorithm will again produce one OTU, (F) but the furthest-neighbor algorithm will group one sequence with the central sequence at random and break the other sequences into their own OTUs.


