
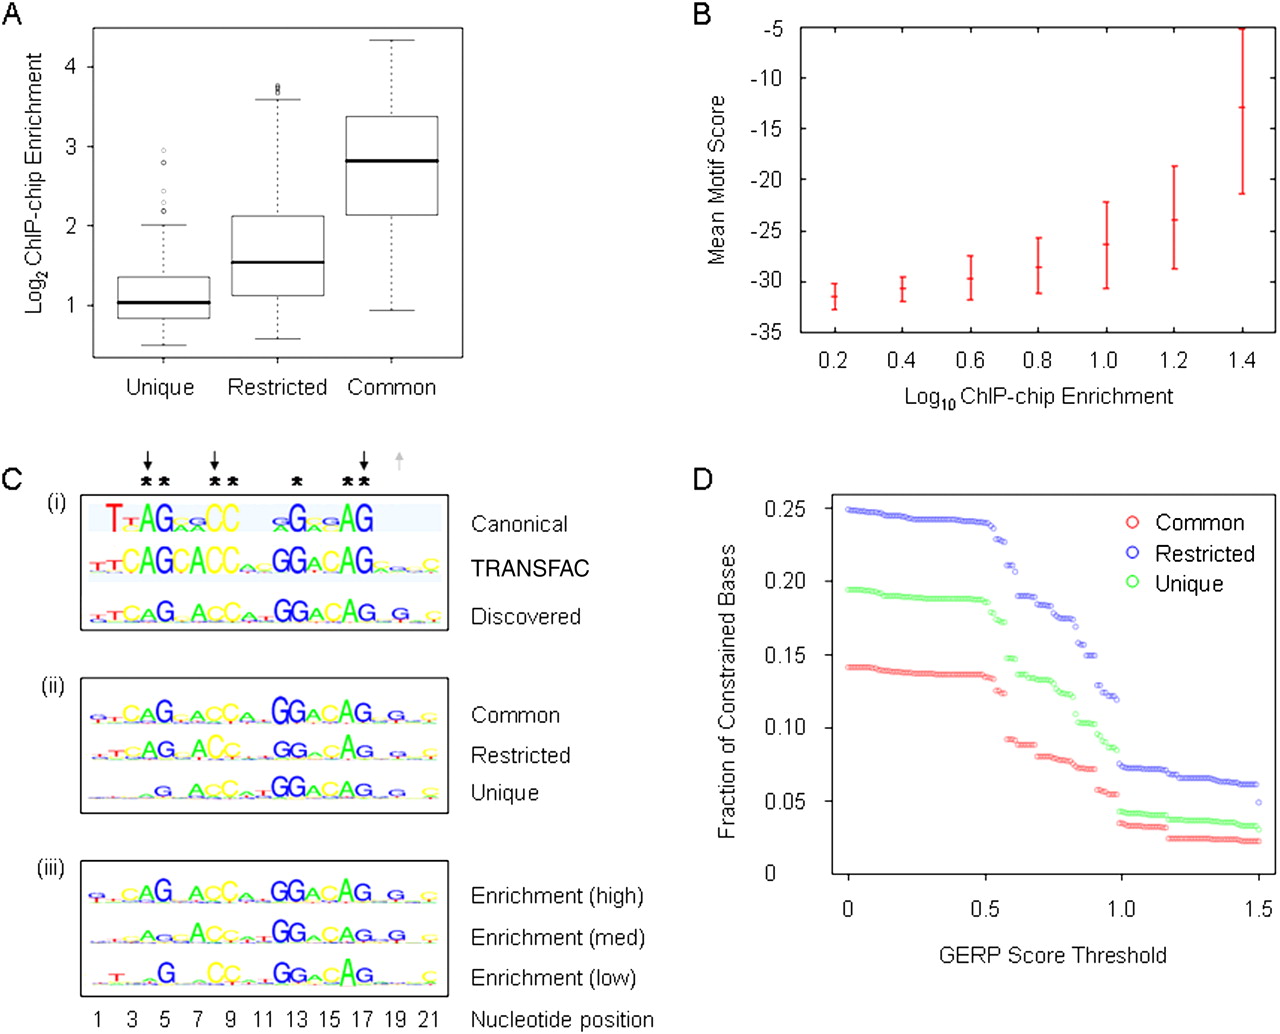
Relationship between REST occupancy, binding affinities, RE1 motifs, and sequence conservation. (A) Relationship between REST ChIP-chip enrichment (y-axis) and REST sites categorized by common, restricted, or unique cell type distribution. (Boxes) Interquartile ranges; error bars are 95% confidence intervals calculated by bootstrapping. (Open circles) Individual enrichment values that fall outside of this range. (B) The mean motif score (red dashes within error bars) for each REST binding site, defined by genome coordinates of relevant microarray tiles, was calculated by the nmscan tool of NestedMICA (y-axis) and is shown as a function of REST ChIP-chip enrichments. REST ChIP-chip enrichments were divided into 0.2-log10 bins. Error bars (red) indicate 95% confidence intervals on the mean motif score, obtained by bootstrapping. (C) (i) The identified motif (“Discovered”) was compared with the sequences of the RE1 consensus motif (“Canonical,” Bruce et al. 2004) and the RE1 motif described in the TRANSFAC database (“TRANSFAC”). The position of each nucleotide is numbered with respect to the TRANSFAC-derived sequence. (Asterisks) Nucleotides that are described as invariant in the RE1 reference motifs (“Consensus” and “TRANSFAC”). (Upward gray arrows) Some of the increased nucleotide constraints in the discovered motif, (downward black arrows) decreased nucleotide constraints. (ii) RE1 motifs identified in REST binding sites categorized by occupancy. (iii) RE1 motifs identified in REST binding sites binned by ChIP enrichment levels. (D) Evolutionary DNA sequence conservation constraints on classes of REST binding sites. The graph shows fraction of constrained bases across the entire sequence of each microarray tile containing the REST binding site (y-axis) with respect to constraint thresholds (x-axis) using the GERP conservation metric.


