
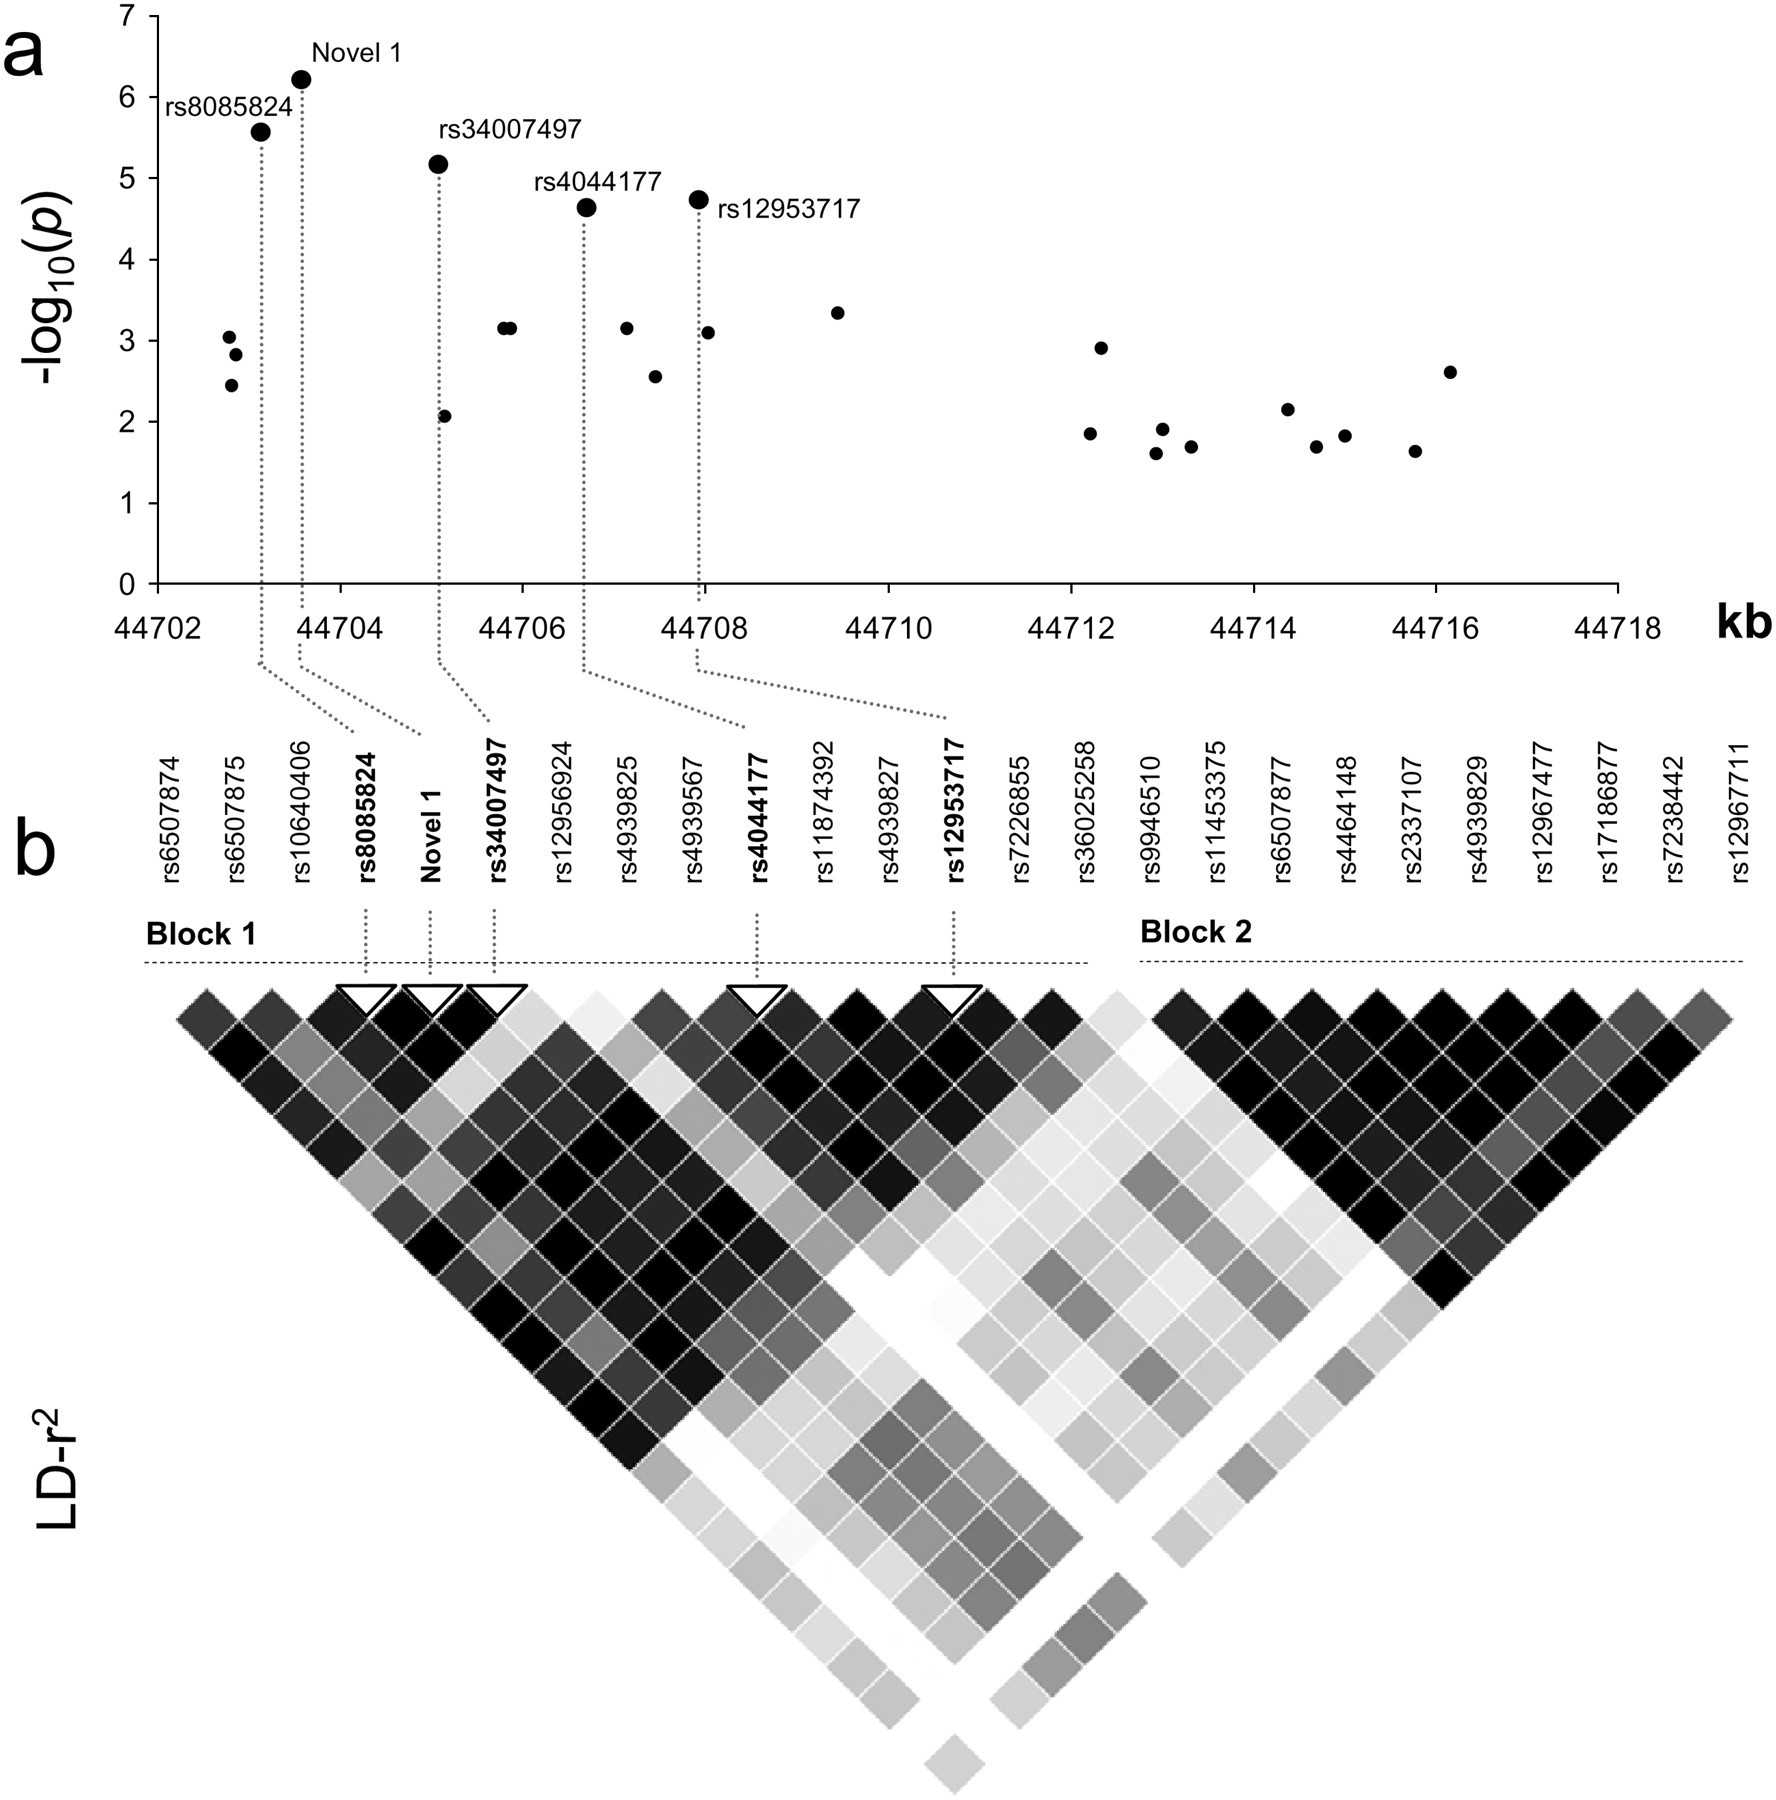
Figure 2.
(a) Single marker association statistics (as –log10 values) for each of the 25 SNPs mapping to the 17-kb region sequenced. The five SNPs with the strongest evidence for an association with colorectal cancer are denoted in blue (rs8085824, Novel1, rs34007497, rs4044177, and rs12953717). (b) Pairwise linkage disequilibrium (r2) metrics of the 25 SNPs calculated in Haploview (v4.0) software. The values indicate the LD relationship between each pair of SNPs; the darker the shading, the greater extent of LD. Shown are the two haplotype blocks defined within the region.


