
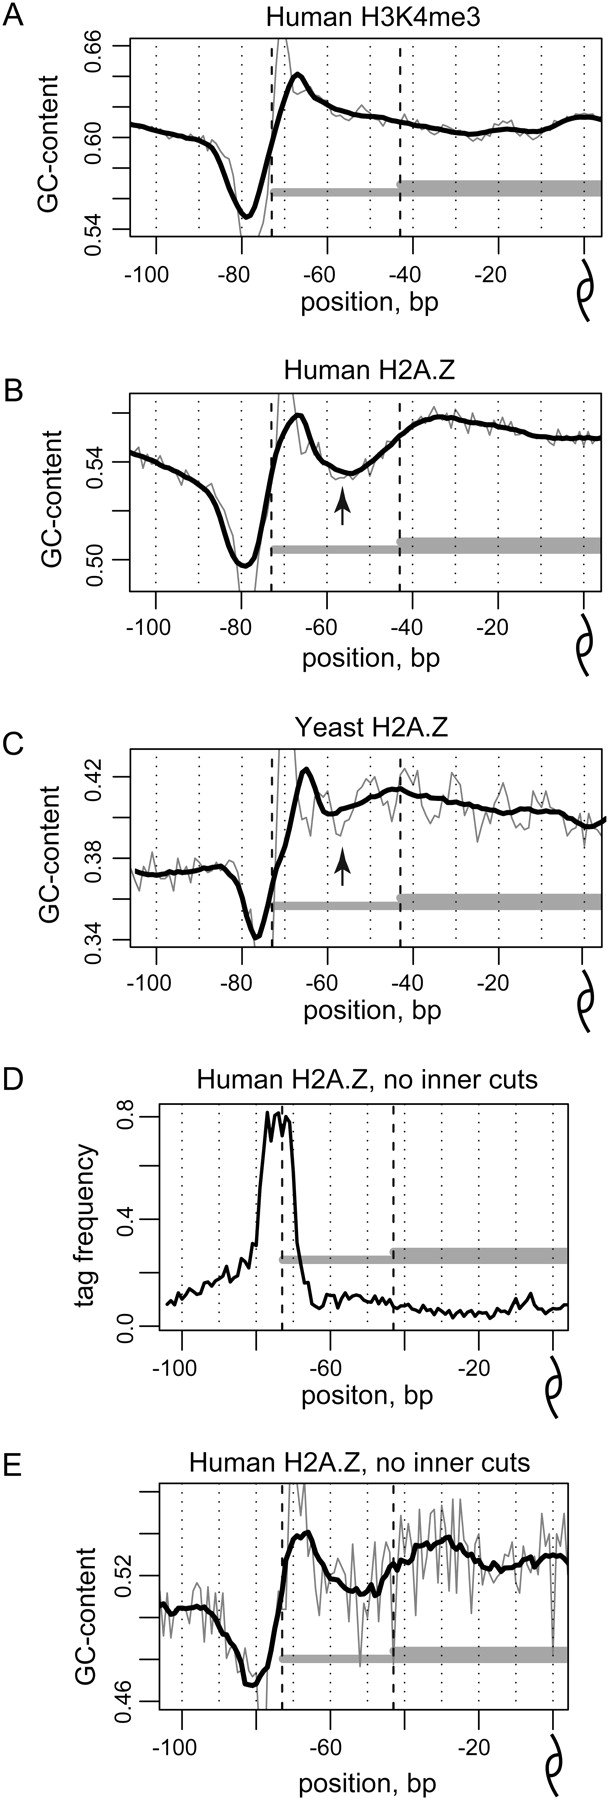
GC profiles of nucleosomal sequences. (A–C) GC profiles, representing the combined fraction of guanines and cytosines at each position along the center-aligned human H3K4me3 sequences (A), human H2A.Z sequences (B), and yeast H2A.Z sequences (C). Both direct and reverse orientations of the sequences were taken into account. The mean GC profile for all the nucleosomal sequences in the corresponding set is shown for positions from −100 to 0 relative to the nucleosome dyad position. Thick black lines denote 11-bp smoothing of the initial data (thin gray lines). Black dashed lines give reference to 117- and 147-bp fragment lengths. Note that the decrease in the GC profile of human H2A.Z sequences at positions ±50–60 corresponds to the similar variation in the yeast profile and, moreover, is colocalized with the most pronounced oscillation in 10-bp periodicity pattern (black arrows). (D,E) The inner variation in the GC profile is not explained by the MNase bias. (D) Tag density and (E) GC profile for the human H2A.Z nucleosomes that are shown for the H2A.Z nucleosome sequences that contain no more than three tags in total at positions from ±68 to ±18.


