
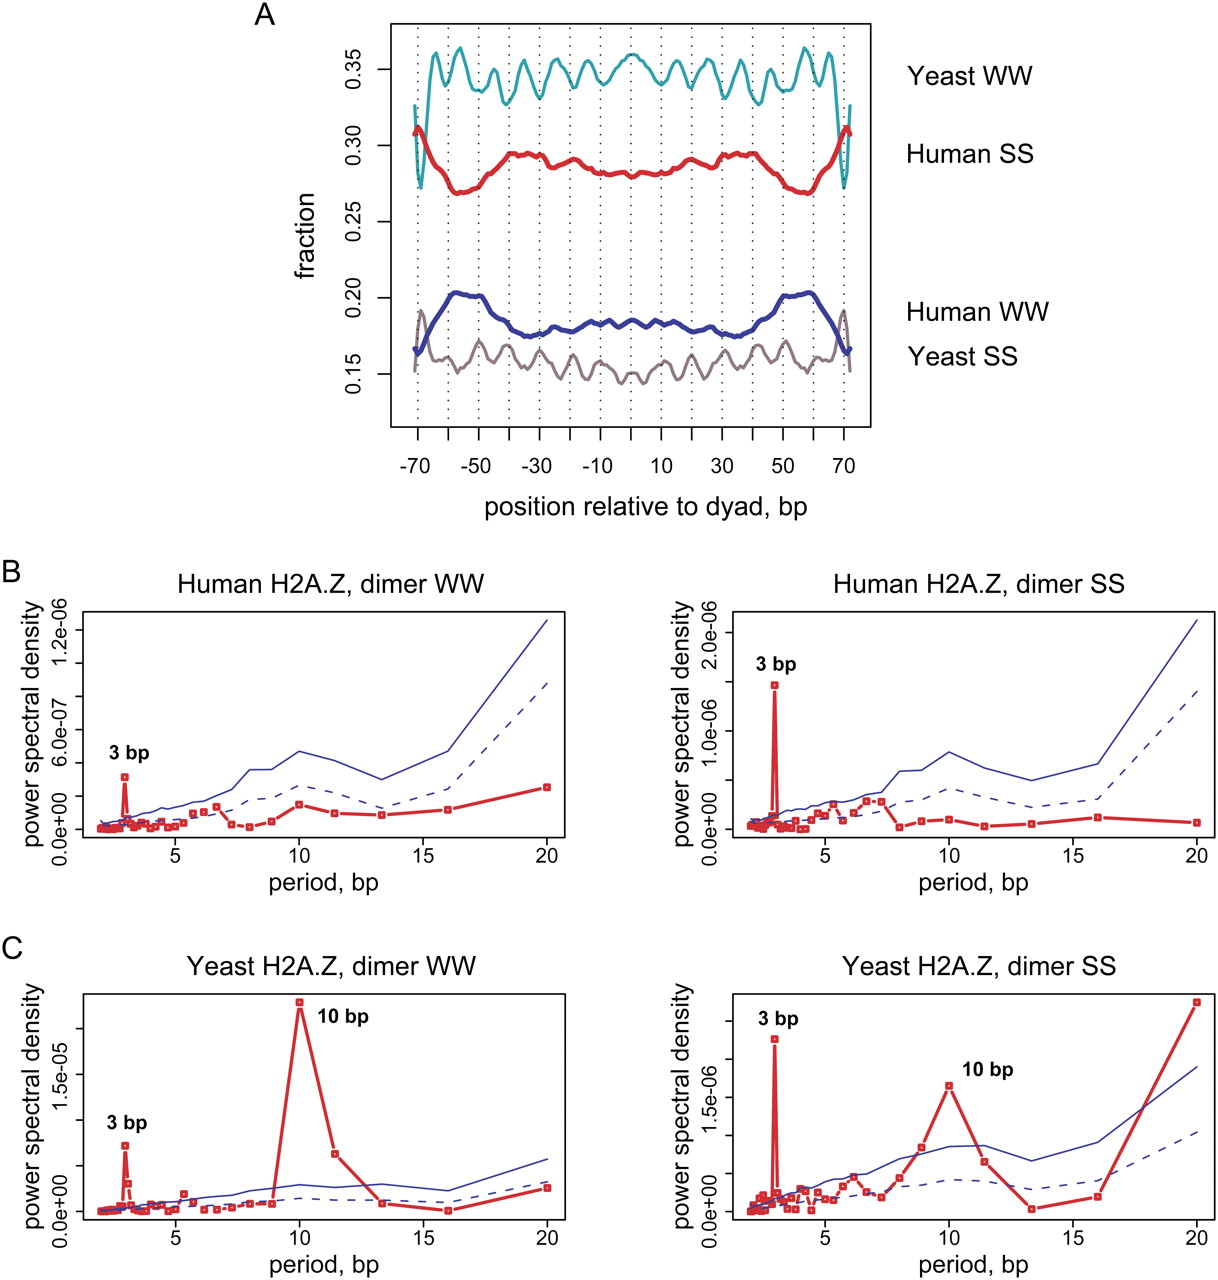
Properties of dinucleotide distributions in yeast and human nucleosomal DNA. (A) Frequency distribution of the AT-rich (WW = AA, TT, AT, TA) and GC-rich (SS = GG, CC, CG, GC) dinucleotides in yeast and human H2A.Z nucleosomal sequences. The yeast sequence set comprises approximately 8000 “well-positioned” H2A.Z nucleosomes identified by pyrosequencing (Albert et al. 2007). Both direct and reverse sequences orientations were considered and the distributions were smoothed with a 3-bp running window. (B,C) Periodograms showing spectral density for the WW and SS dinucleotide autocorrelation functions are shown for (B) human and (C) yeast H2A.Z nucleosomes. Nucleosomal sequences from position −70 to position +70 relative to the dyad were taken for the analysis. The red lines in the periodograms represent the power spectral density for nucleosomal sequences; solid and dashed blue lines represent the statistical significance levels P = 0.001 and P = 0.05 as estimated based on the 10,000 randomizations (not corrected for multiple hypothesis testing; see Methods).


