
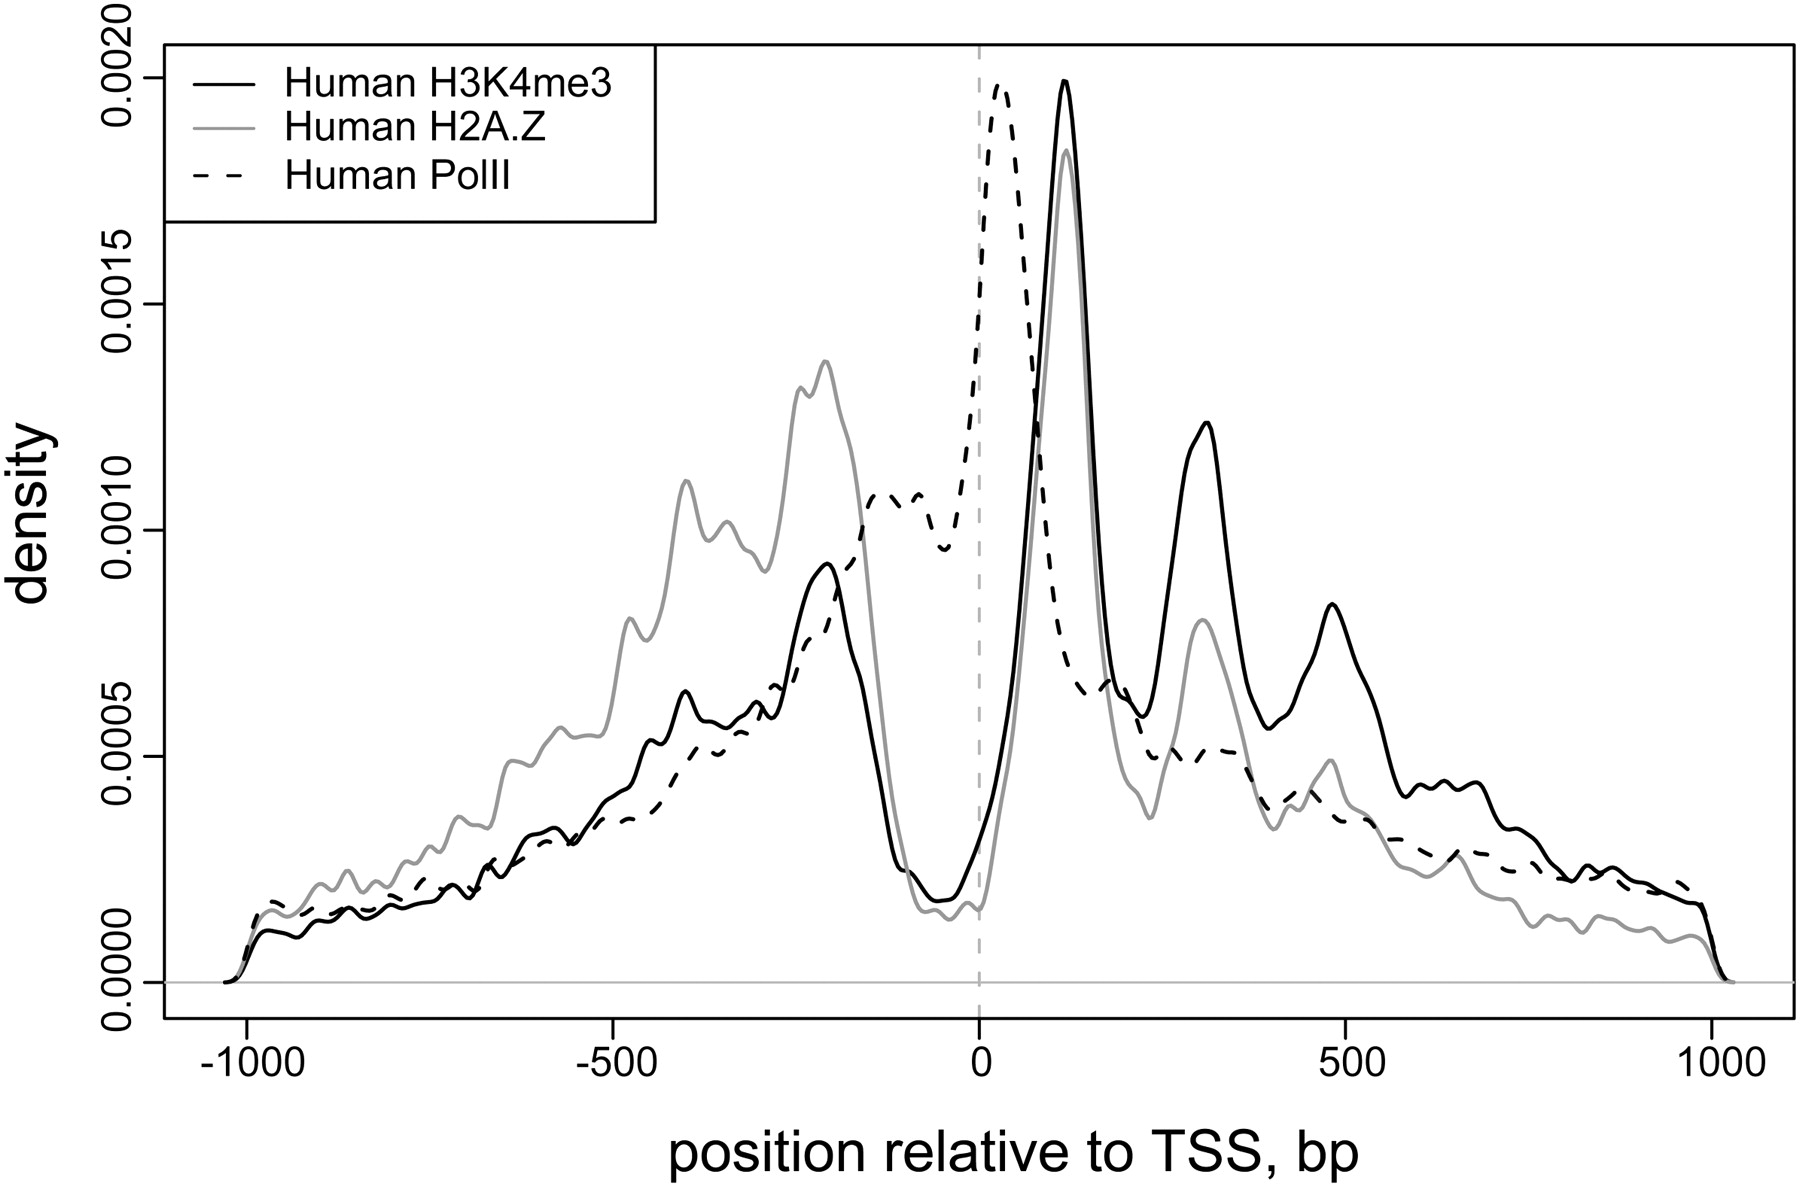
Figure 3.
Distribution of predicted nucleosome positions around transcription start sites (TSS). The overall density of determined H3K4me3- and H2A.Z-enriched nucleosome positions is shown relative to the TSS position, with the direction of transcription oriented from left to right. Distribution of RNA Pol II binding sites is shown for reference. The nucleosome density is calculated using a Gaussian kernel with bandwidth of 5 bp. Both H2A.Z- and H3K4me3-enriched nucleosomes show preferred stable positions flanking the nucleosome-free region around TSS, with H3K4me3-enriched nucleosome arrays extending further downstream.


