
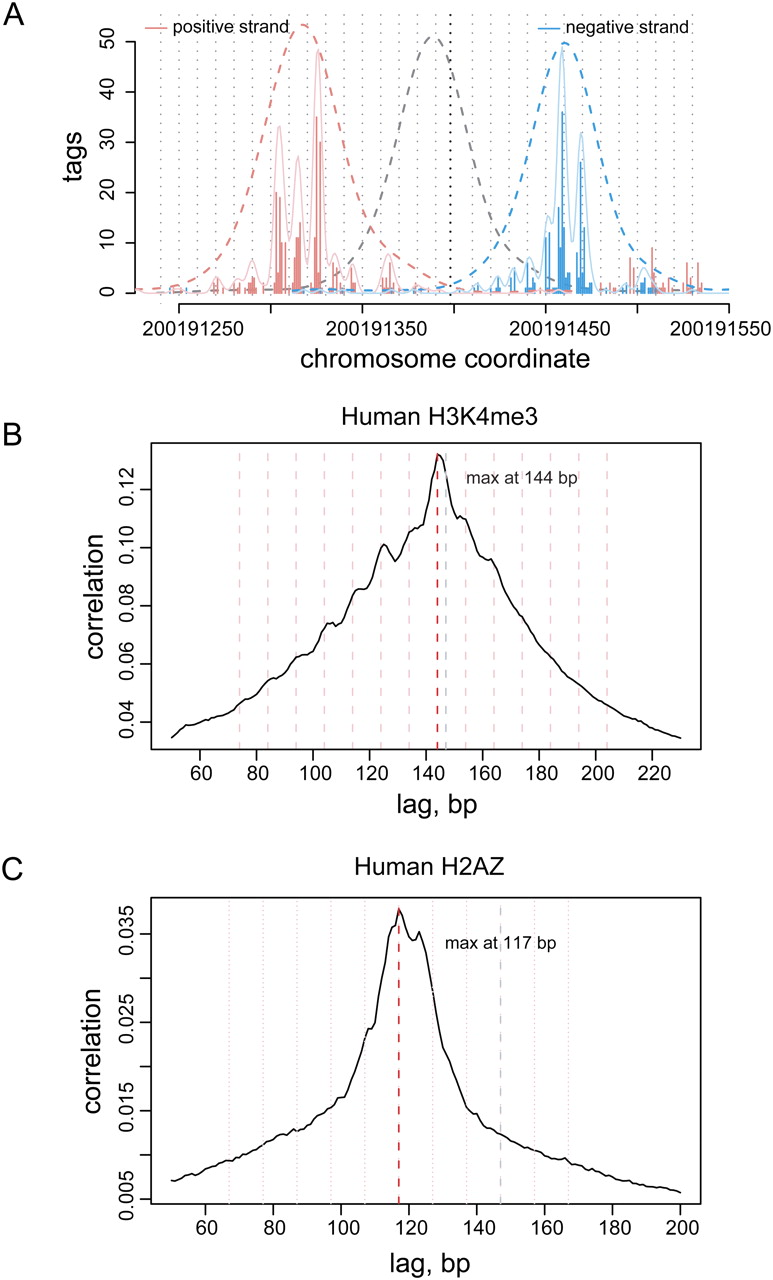
Stable nucleosome positions determined from ChIP-Seq data. (A) Tag distribution at a site of strongly positioned nucleosome. (Vertical bars) The number of sequence tags mapping to the positive (red) and negative (blue) strands around the location of a well-positioned H3K4me3-enriched nucleosome. The approximate positions of the ends and center of the nucleosome-protected fragment are estimated based on coarse-grain tag density fit (dashed curves). The position of the fragment center is then refined using fine-grain fit (solid blue and red lines, vertical black dotted line indicates the center of the fine-grain prediction; see Methods). Secondary positions located at multiples of 10 bp can be clearly seen in this example (gray dotted lines). (B) Predominant length of the DNA fragments protected by H3K4me3-enriched nucleosomes, determined from tag density cross-correlation. Pearson linear correlation (y-axis) is calculated between number of tags mapped along positive and negative strands, shifting the positive-strand coordinates relative to the negative in 1-bp increments (x-axis). The cross-correlation maximum observed around 144 bp (red line) corresponds to the predominant fragment length. Secondary peaks are positioned at multiples of 10 bp away from the maximum (pink lines). (C) H2A.Z nucleosomes tend to protected fragments ∼120 bp long, notably shorter than the 147 bp (gray line) expected for a canonical nucleosome. The cross-correlation plot for the H2A.Z tag data shows a broad peak ∼120 bp with a maximum at 117 bp (red line).


