
Table 2.
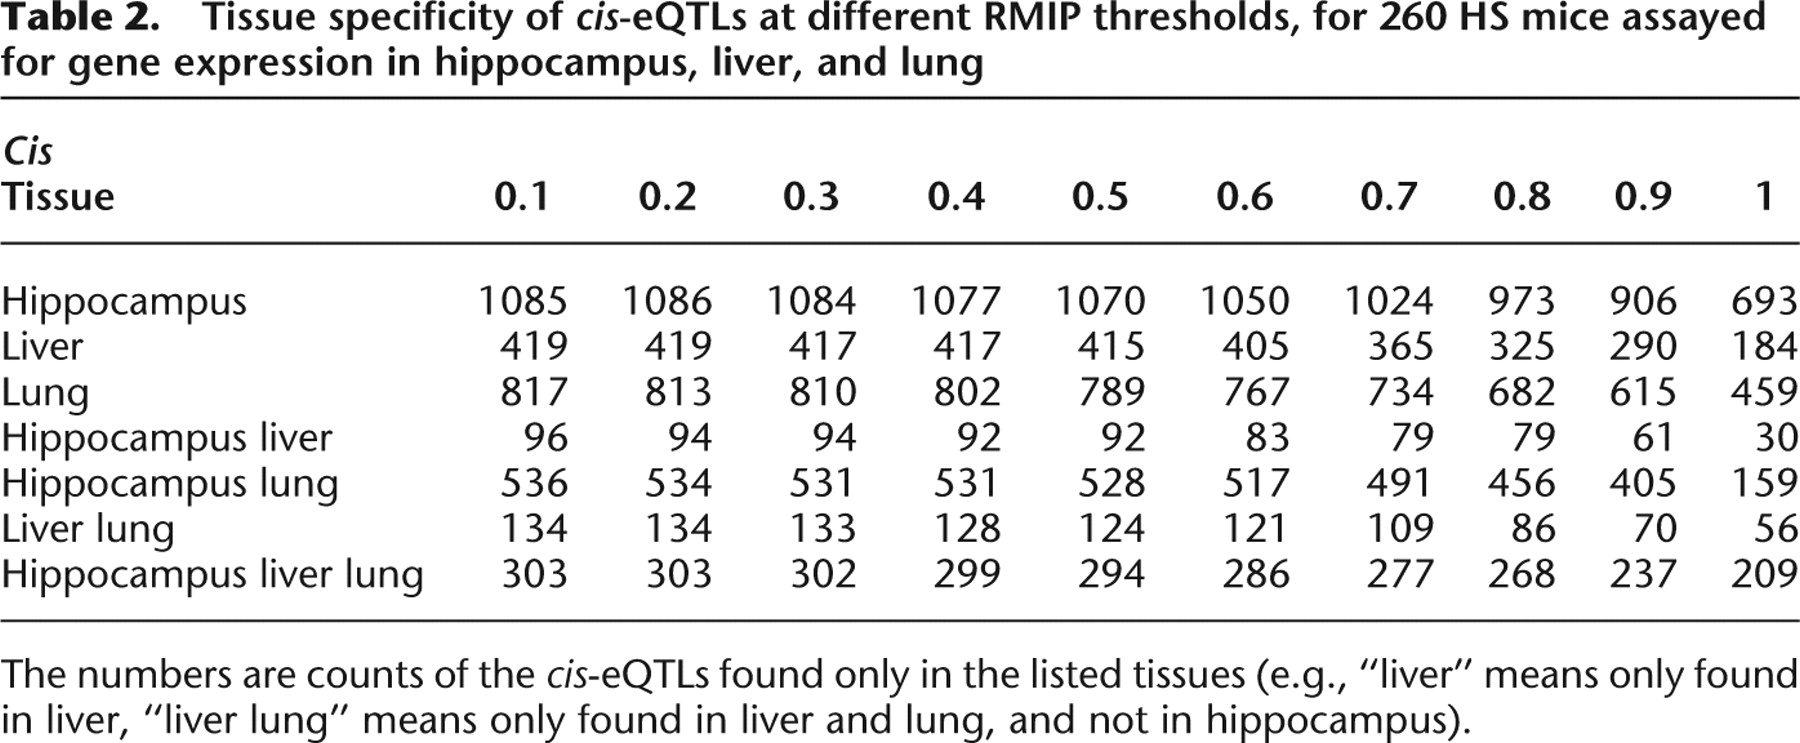
Tissue specificity of cis-eQTLs at different RMIP thresholds, for 260 HS mice assayed for gene expression in hippocampus, liver, and lung
Click on table to view larger version.
-
The numbers are counts of the cis-eQTLs found only in the listed tissues (e.g., “liver” means only found in liver, “liver lung” means only found in liver and lung, and not in hippocampus).


