
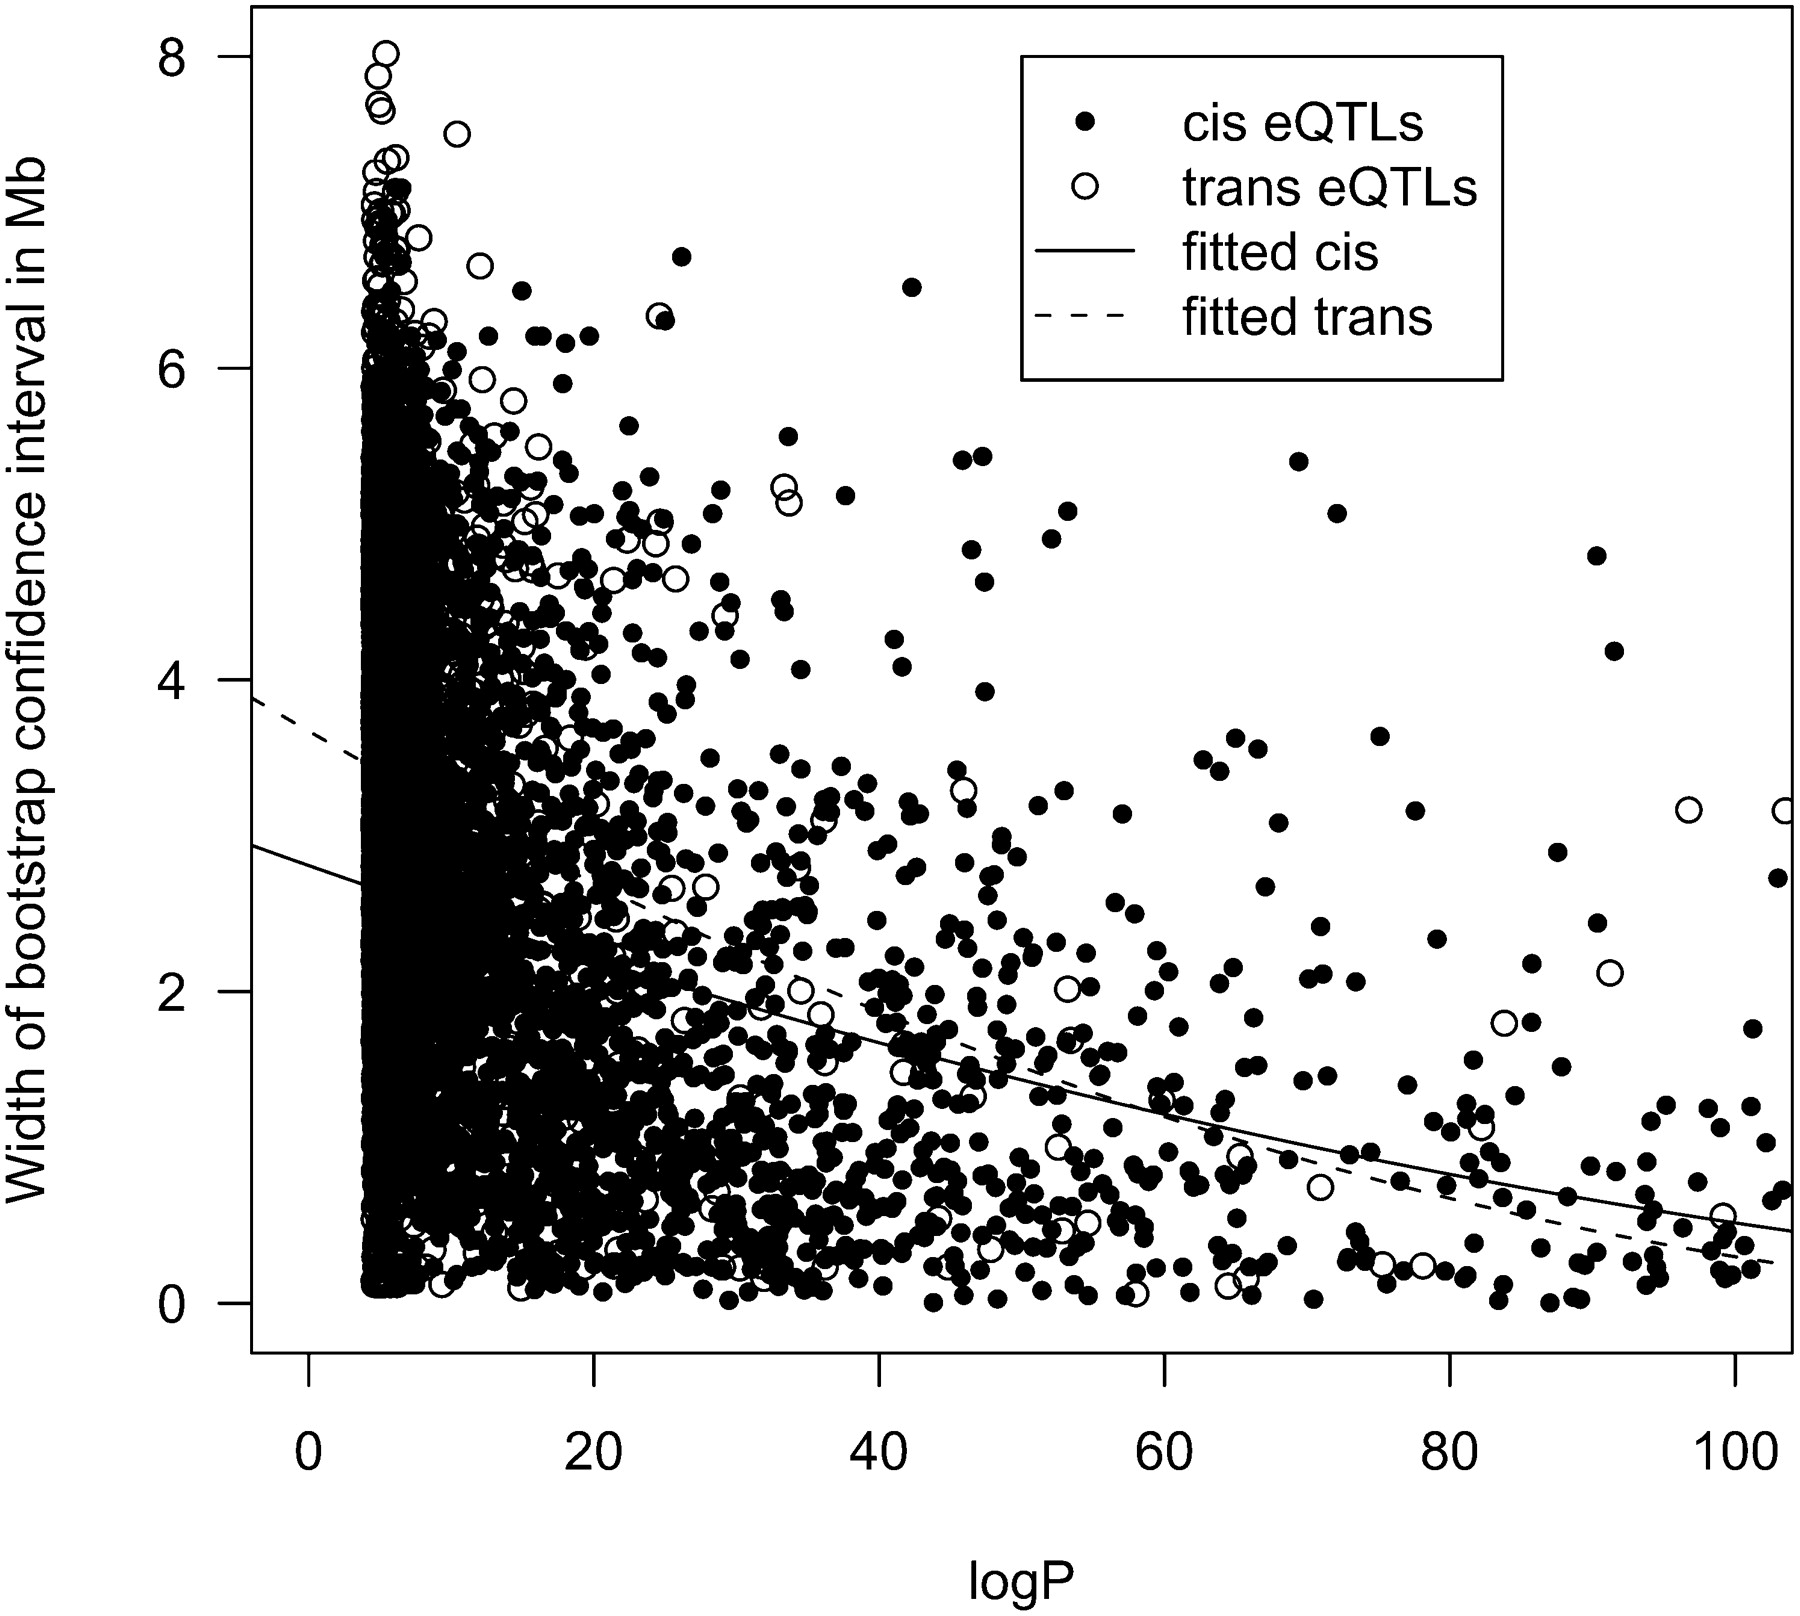
Figure 5.
Bootstrap derived 95% confidence of cis- and trans-eQTLs plotted against their respective logP. The size of the interval is shown on the vertical axis in megabases, and the ANOVA logP on the horizontal axis. Trans-eQTLs are shown as open circles, cis-eQTLs as filled circles. A regression curve fitted to the square root of the confidence interval is shown for trans-eQTLs (dotted) and cis-eQTLS (continuous).


