
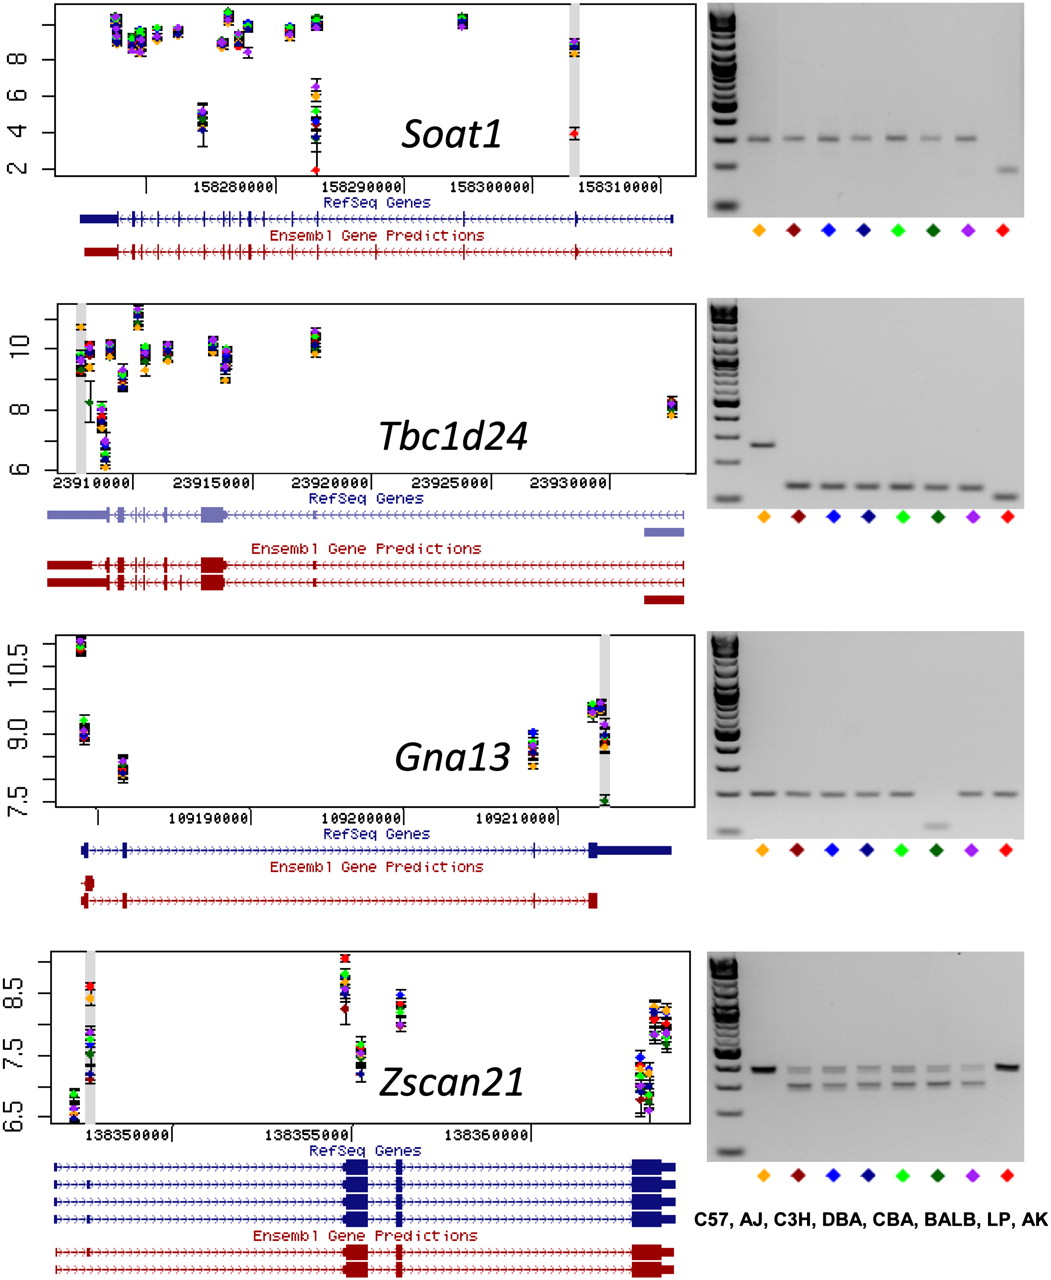
Splicing variants. Predicted transcript isoforms for four genes (Soat1, Tbc1d24, Gna13, and Zscan21) are shown on the left, based on the exon-array data. Each dot is the average of three measurements of the probe set signal intensity for one of the eight inbred strains. A gray horizontal bar identifies probe sets judged to show significant variation between the strains. RefSeq and Ensembl predicted gene structure are taken from the UCSC Genome Browser (http://www.genome.ucsc.edu). Exon PCR results are shown on the right. In two cases (Gna13 and Tbc1d24) PCR primers amplify across a single terminal exon. For Soat1 and Zscan21 primers were designed that amplify flanking exons. Each mouse inbred strain is indicated by a different color. Strain names are as follows: C57, C57BL/6J; AJ, A/J; C3H, C3H/HeJ; DBA, DBA/2J; CBA, CBA/J; BALB, BALBc/J; LP, LP/J; AK, AKR/J. The PCR results suggest the following as an explanation for the inbred strains differences in exon-specific hybridization signal: (1) exon skipping of the second exon of Soat1 in AKR/J (AK, red diamond); (2) newly identified spliced introns within 5′ UTR of Tbc1d24 in all strains except for C57BL/6J (C57, yellow); (3) newly identified spliced intron within the 3′ UTR of Gna13 in BALBc/J (BALB, dark green); (4) alternative splicing by exon skipping of the second exon of Zscan21 in all strains except for C57BL/6J and AKR/J (C57; yellow; AK, red).


