
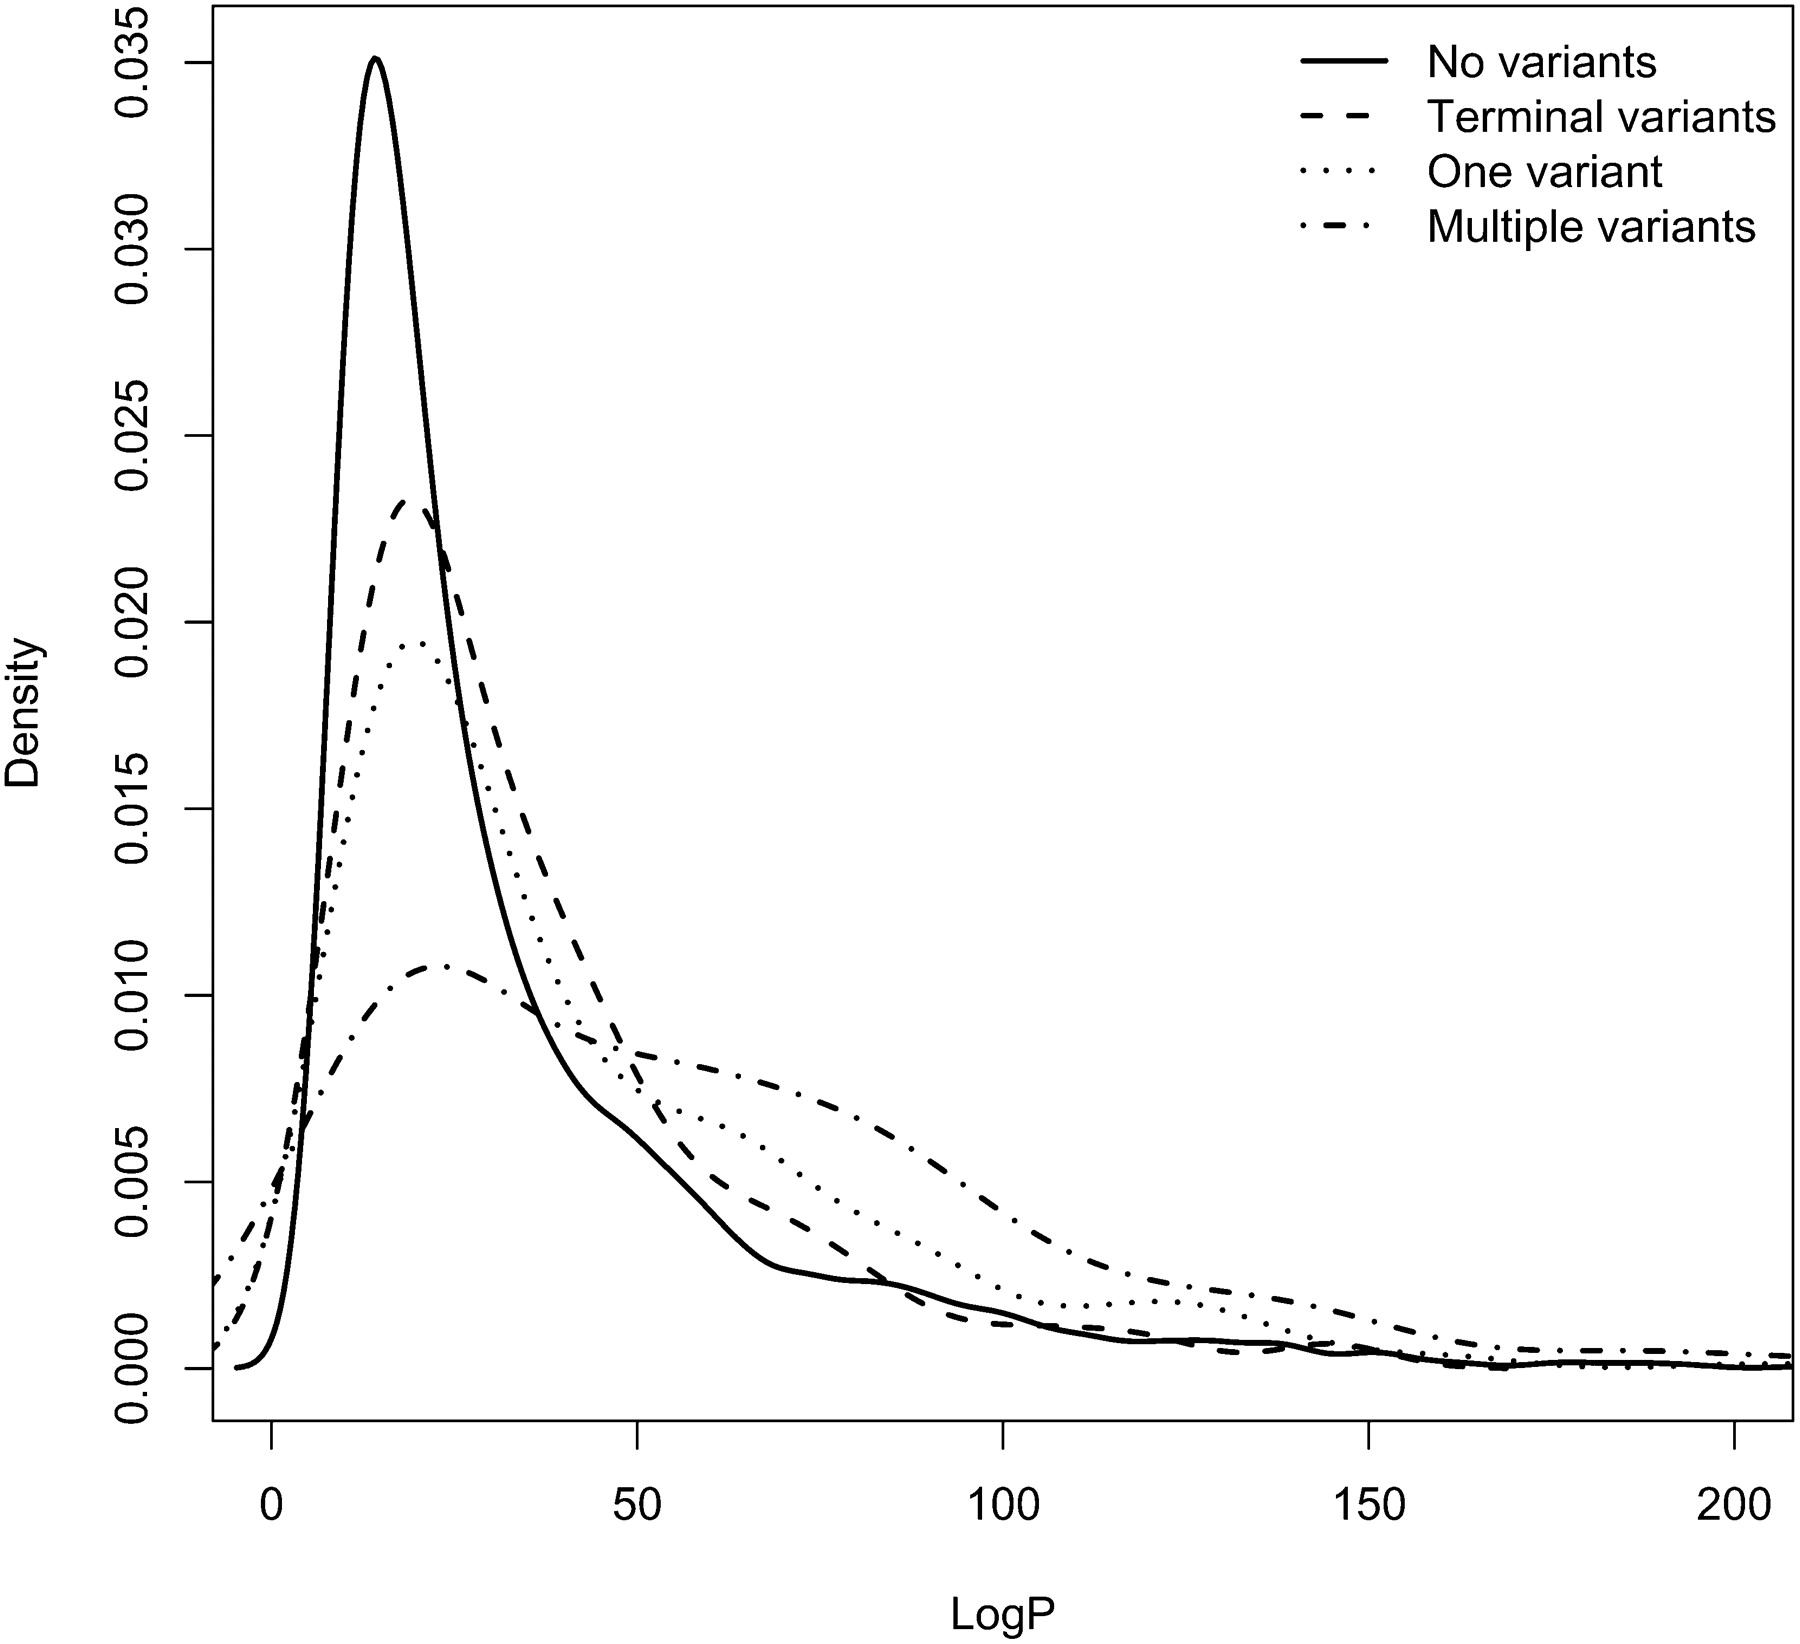
Figure 3.
Effect of sequence variants on cis-eQTL detection. The frequency (vertical axis) of logP (negative logarithm of the P-value) scores (horizontal axis) for cis-acting eQTLs is shown. Data for cis-eQTLs with no annotated variant (solid line) are compared with data for cis-eQTLs with terminal variants (a SNP in the first two or last base pairs of the probe sequence) and with central variants (defined as any SNP that is not a terminal variant).


