
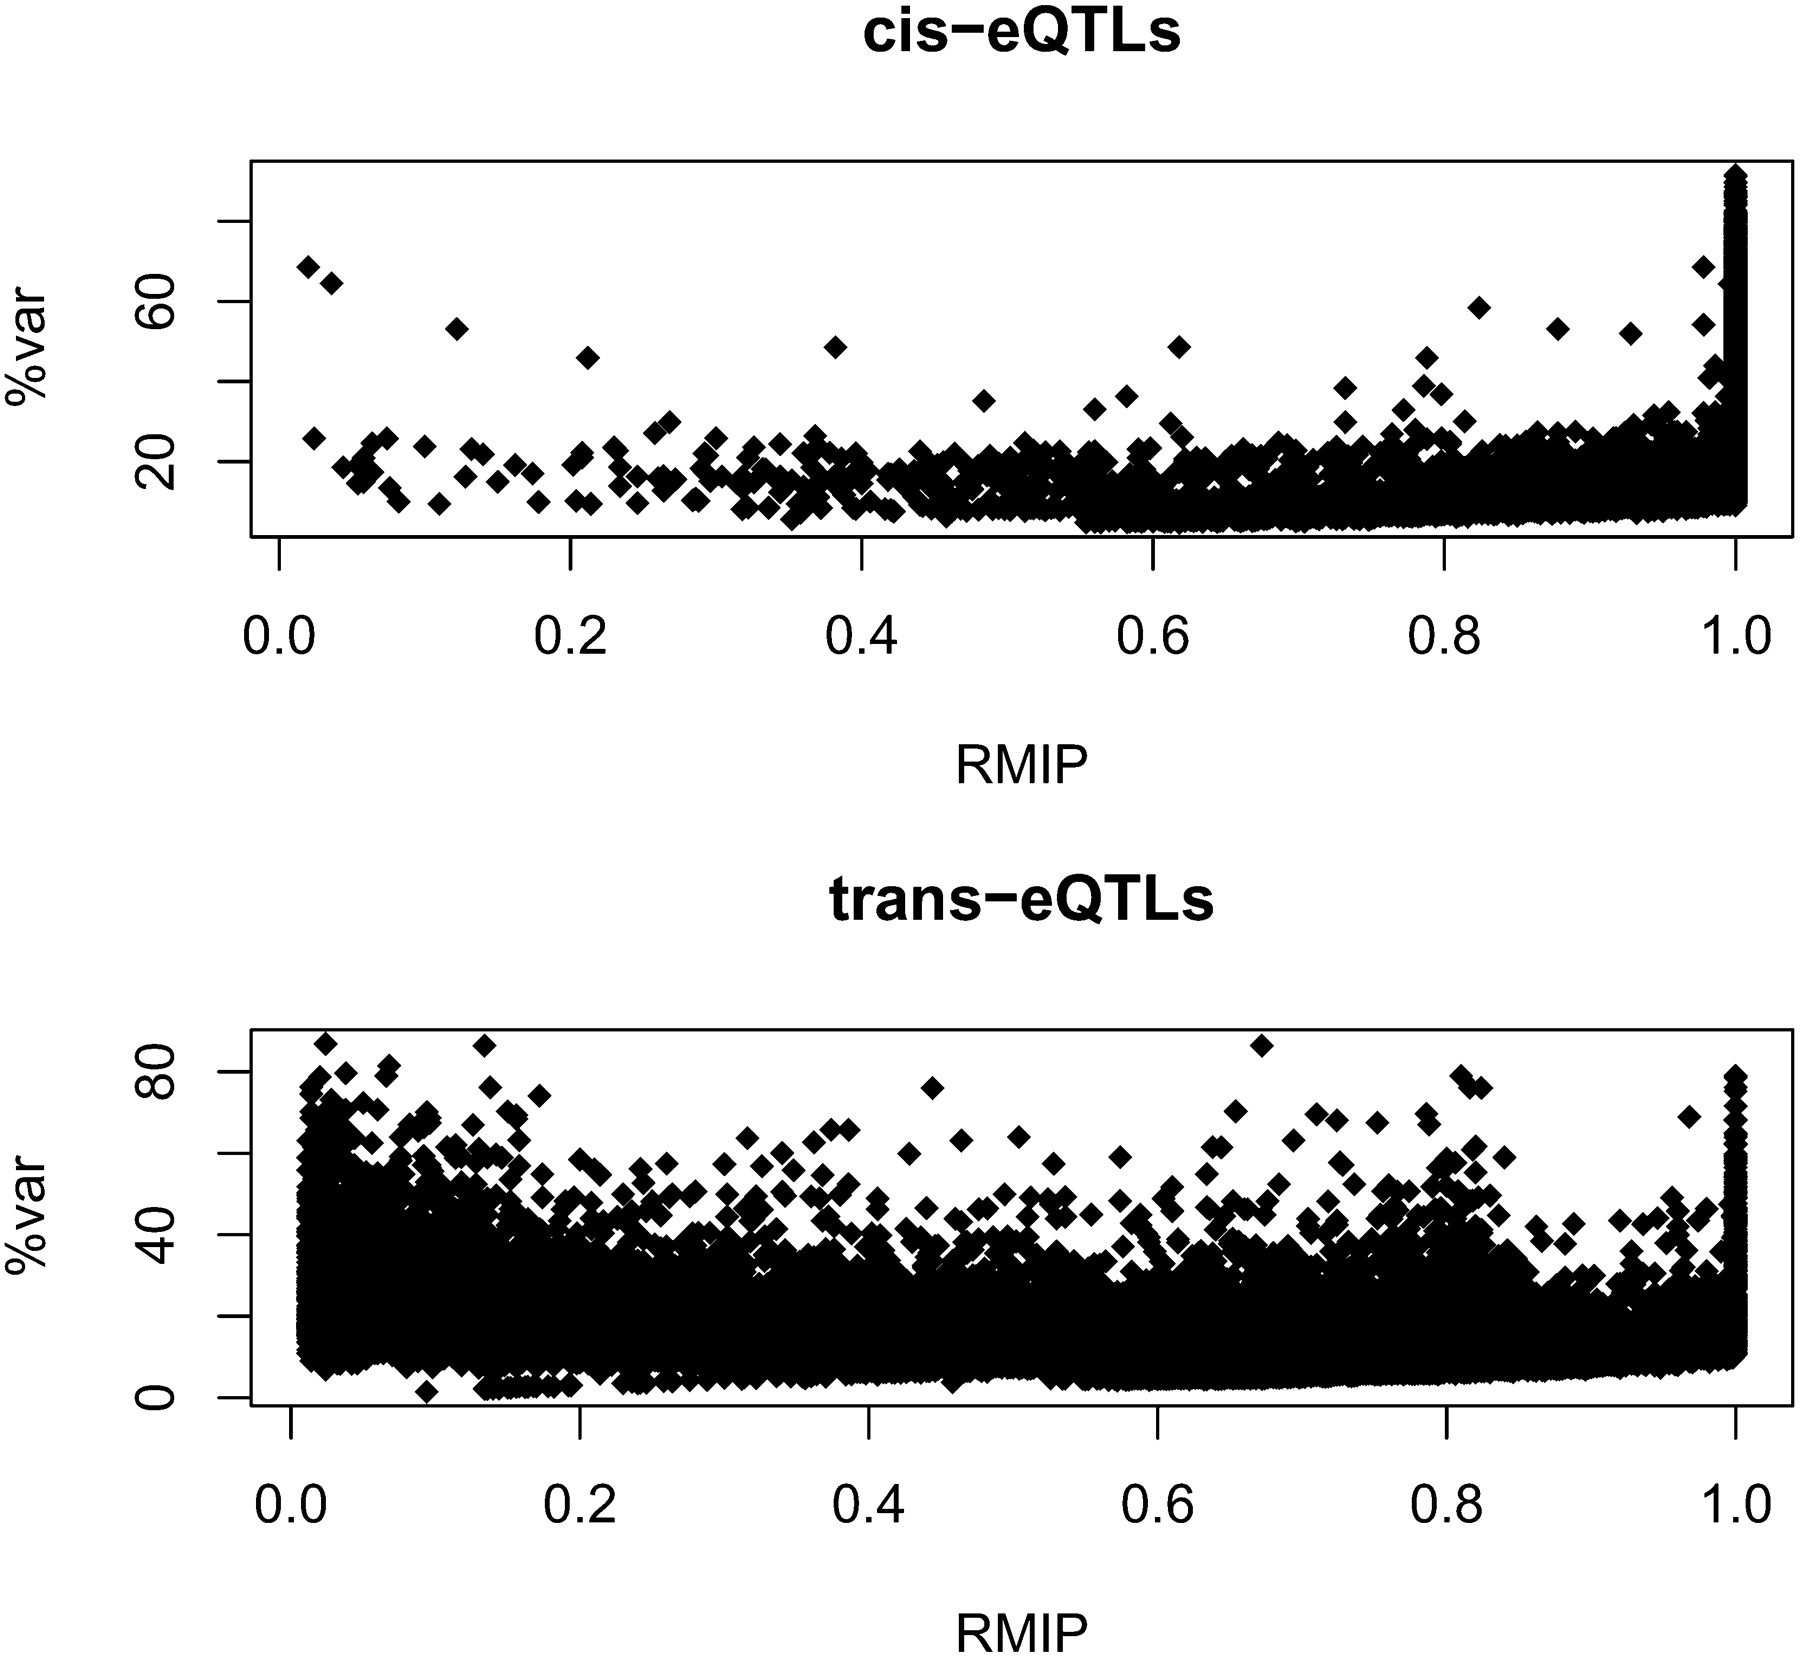
Figure 2.
Relationship between the RMIP and effect size (expressed as percentage of the variation in transcript level [%var]) for cis- and trans-eQTLs.
(Downloading may take up to 30 seconds. If the slide opens in your browser, select File -> Save As to save it.)
Click on image to view larger version.
Relationship between the RMIP and effect size (expressed as percentage of the variation in transcript level [%var]) for cis- and trans-eQTLs.
 CiteULike
 Delicious
 Digg
Digg Facebook
 Google+
 Reddit
 Twitter
