
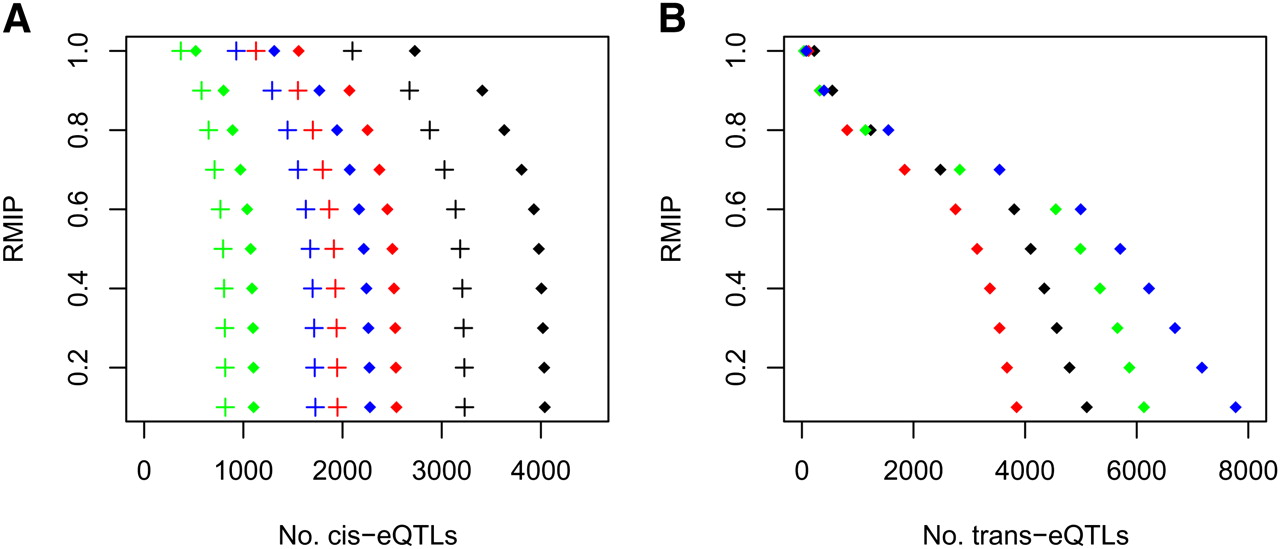
Figure 1.
(A) The number of cis-eQTLs for each of three tissues at different RMIP thresholds (vertical axis). Numbers are shown for cis-eQTLs containing no annotated SNPs (crosses) and for all cis-eQTLs (diamonds). Lung data are shown in blue, liver in green, and hippocampus in red (260 animals) and black (460 animals). (B) The number of trans-eQTLs for each of three tissues at different RMIP thresholds (vertical axis). Lung data are shown in blue, liver in green, and hippocampus in red (260 animals) and black (460 animals).


