
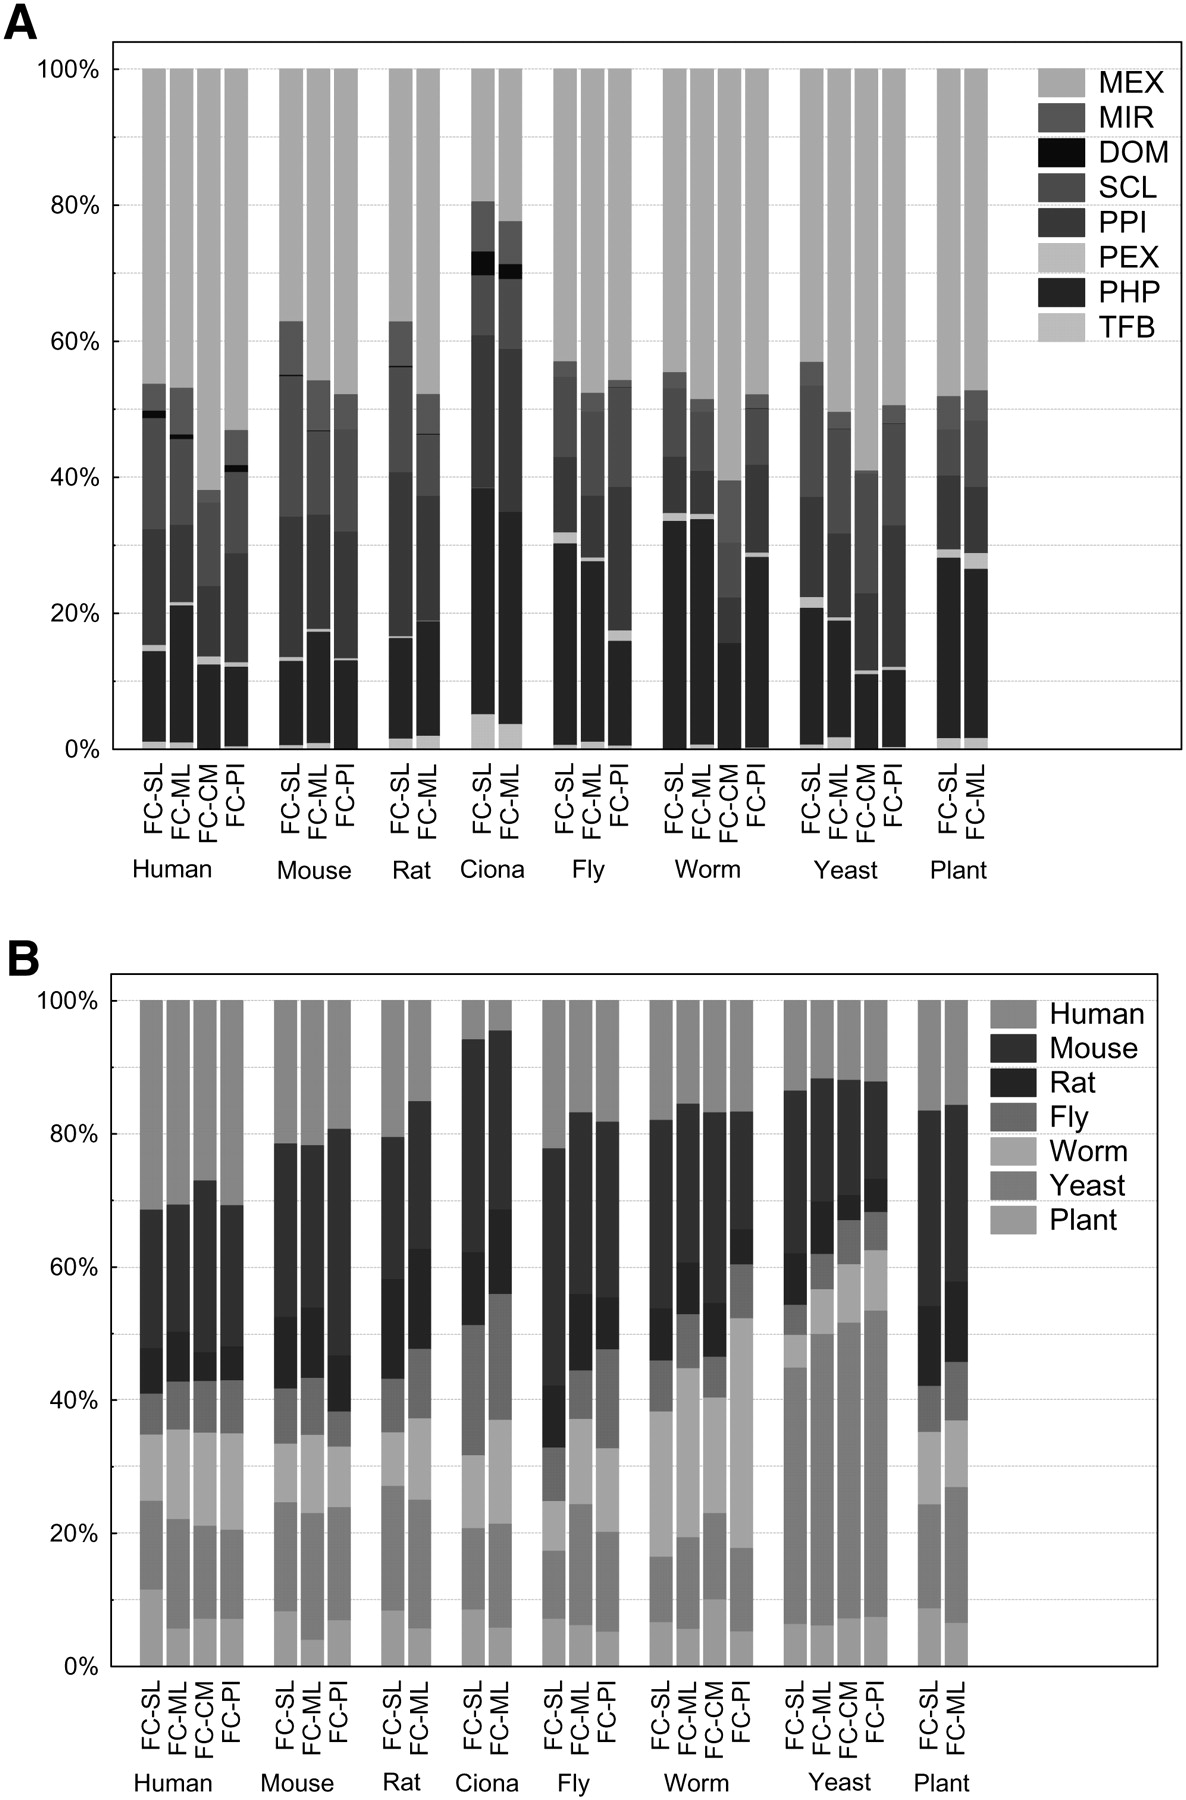
Figure 3.
Relative evidence contribution to FunCoup networks viewed by input data type (A) or species (B). For each evidence category in each species and FC class, we calculated the sum of its contributions to the final Bayesian score (FBS) over the whole predicted network, i.e., the set of links with FBS > 3. Then, these sums were normalized by dividing with the sum of FBS scores over the same set. Note that no input data from Ciona was used. Data-type legends as in Figure 1.


