
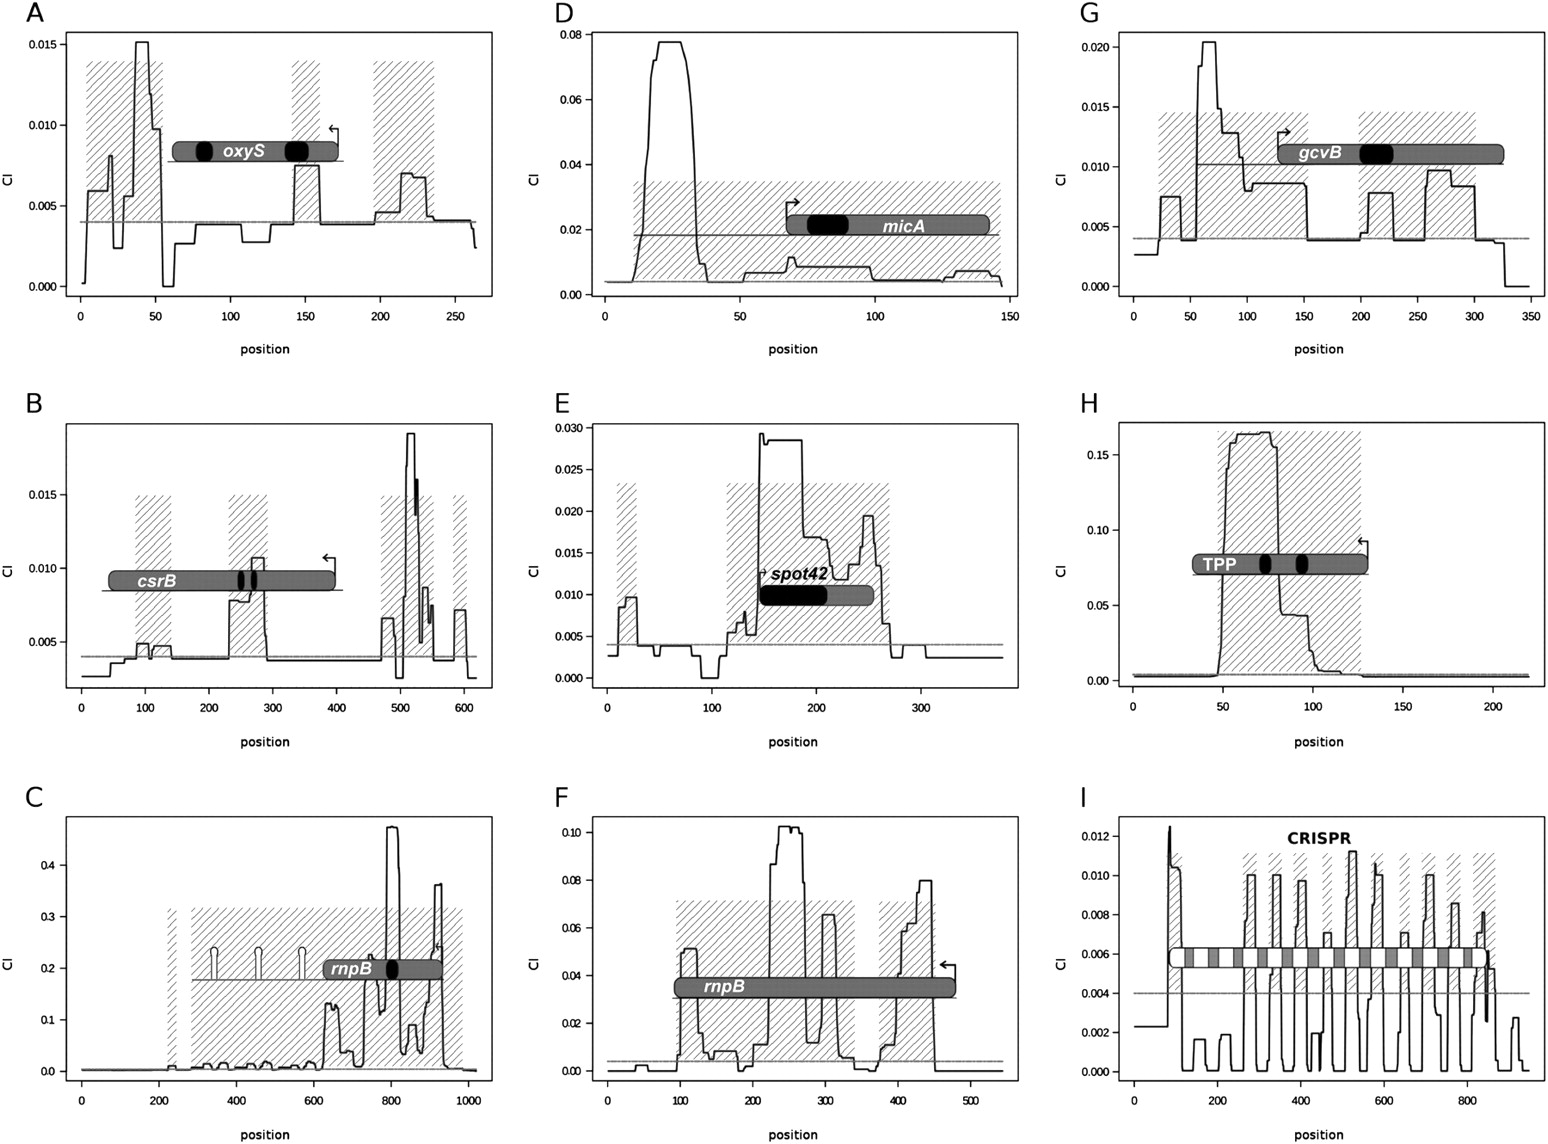
Conservation profiles in selected bacterial noncoding regions. The vertical axis represents the conservation index (CI) and the horizontal axis represents genome coordinates in relative numbering. The CI threshold used for defining conserved noncoding elements (CNEs) is represented by a horizontal line at CI = 0.004. CNEs are denoted by shaded areas. Color code for RNA elements: RNA genes are gray with black areas representing known target-binding regions, CRISPR spacers are gray and CRISPR repeats are light gray. Transcription initiation sites are shown with broken arrows and terminators with hairpins. (A,B,D,E,G) E. coli regulatory sRNA genes; (H) E. coli TPP riboswitch; (C) E. coli RNase P RNA gene; (F) B. subtilis RNase P RNA gene; and (I) E. coli CRISPR locus.


