
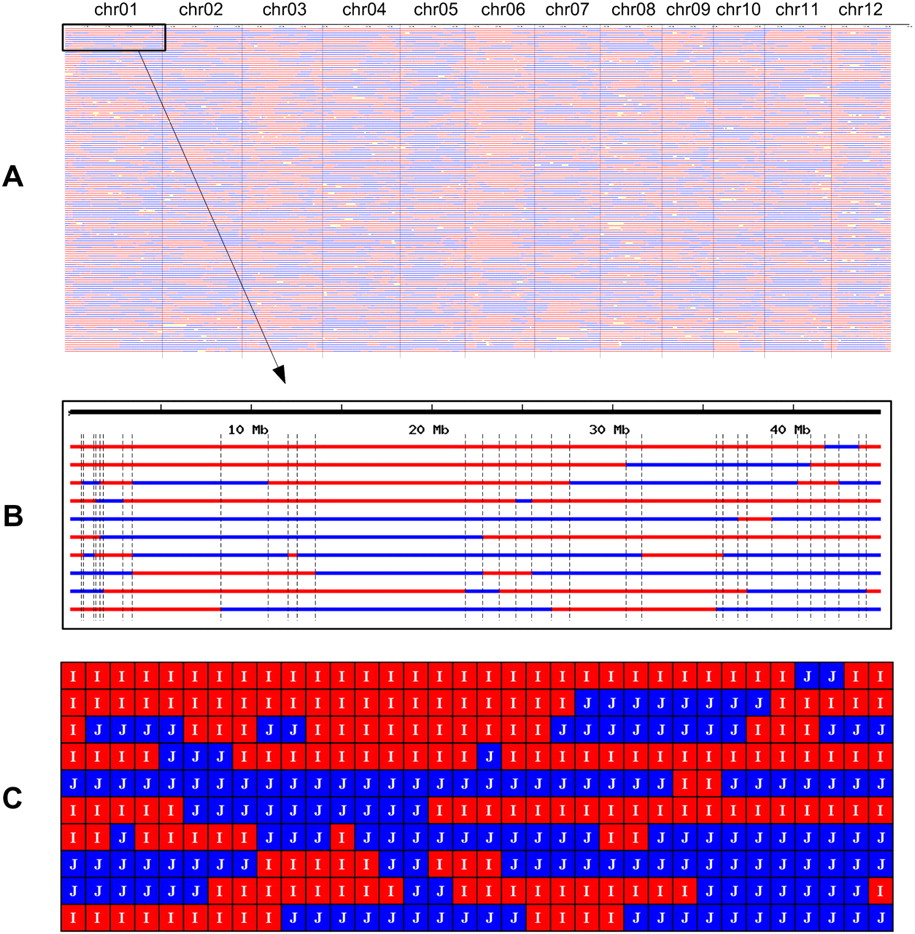
Figure 4.
Recombination and bin maps. (A) Aligned recombination maps of 150 rice RILs. Red, ind/ind; blue, jap/jap; yellow, ind/jap. (B) Aligned chromosome 1 of the first ten RILs. Scale indicates physical distance. A vertical line labels a recombination breakpoint. A region between two vertical lines across all RILs is recognized as a recombination bin. (C) Bin map of the 10 RILs.


