
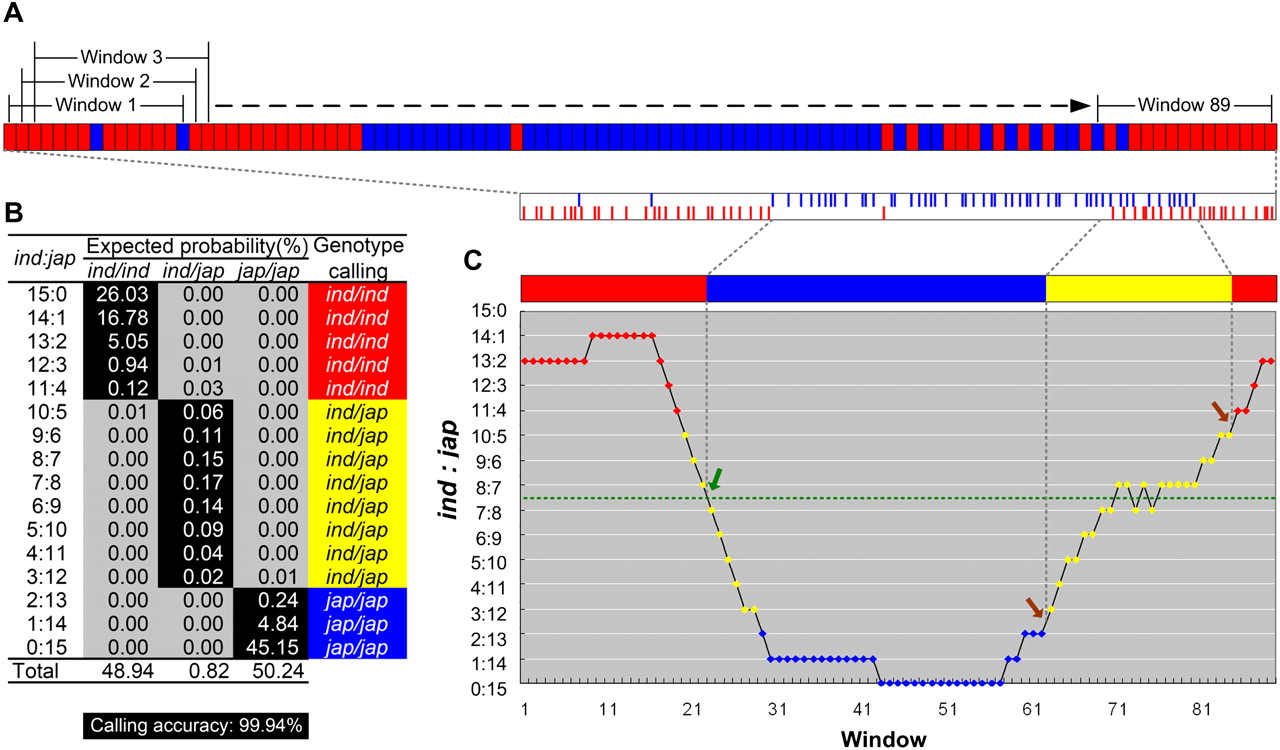
Sliding window approach for genotype calling and recombination breakpoint determination. (A) The top stripe of blocks represents SNPs along the hypothetical chromosomal region. This was redrawn from the two stripes of short vertical lines below illustrating SNPs detected by aligning 33-mers with the parental genome sequences. (Red) Indica genotype; (blue) japonica genotype. A sliding window covering 15 SNPs moves from left to right one base at a time. For each window, the ratio of the number of indica to japonica SNPs (ind:jap) is calculated. (B) Genotype calling based on the highest expected probabilities: Call homozygous indica genotype (ind/ind) when ind:jap ≥ 11:4; call heterozygous genotype (ind/jap) when 10:5 ≥ ind:jap ≥ 3:12; call homozygous japonica genotype (jap/jap) when ind:jap ≤ 2:13. Adding together the probabilities of these callings (shaded in black) gives the calling accuracy of 99.94%. (C) As the window slides, genotypes are called and recombination breakpoints are determined. Green and brown arrows point to breakpoints between two homozygous genotypes and between the heterozygous and homozygous genotypes, respectively. The resulting recombination map for this chromosomal region is illustrated in a solid bar, in which red, blue, and yellow represent genotypes ind/ind, jap/jap, and ind/jap, respectively. Identified breakpoints are indicated between SNPs.


