
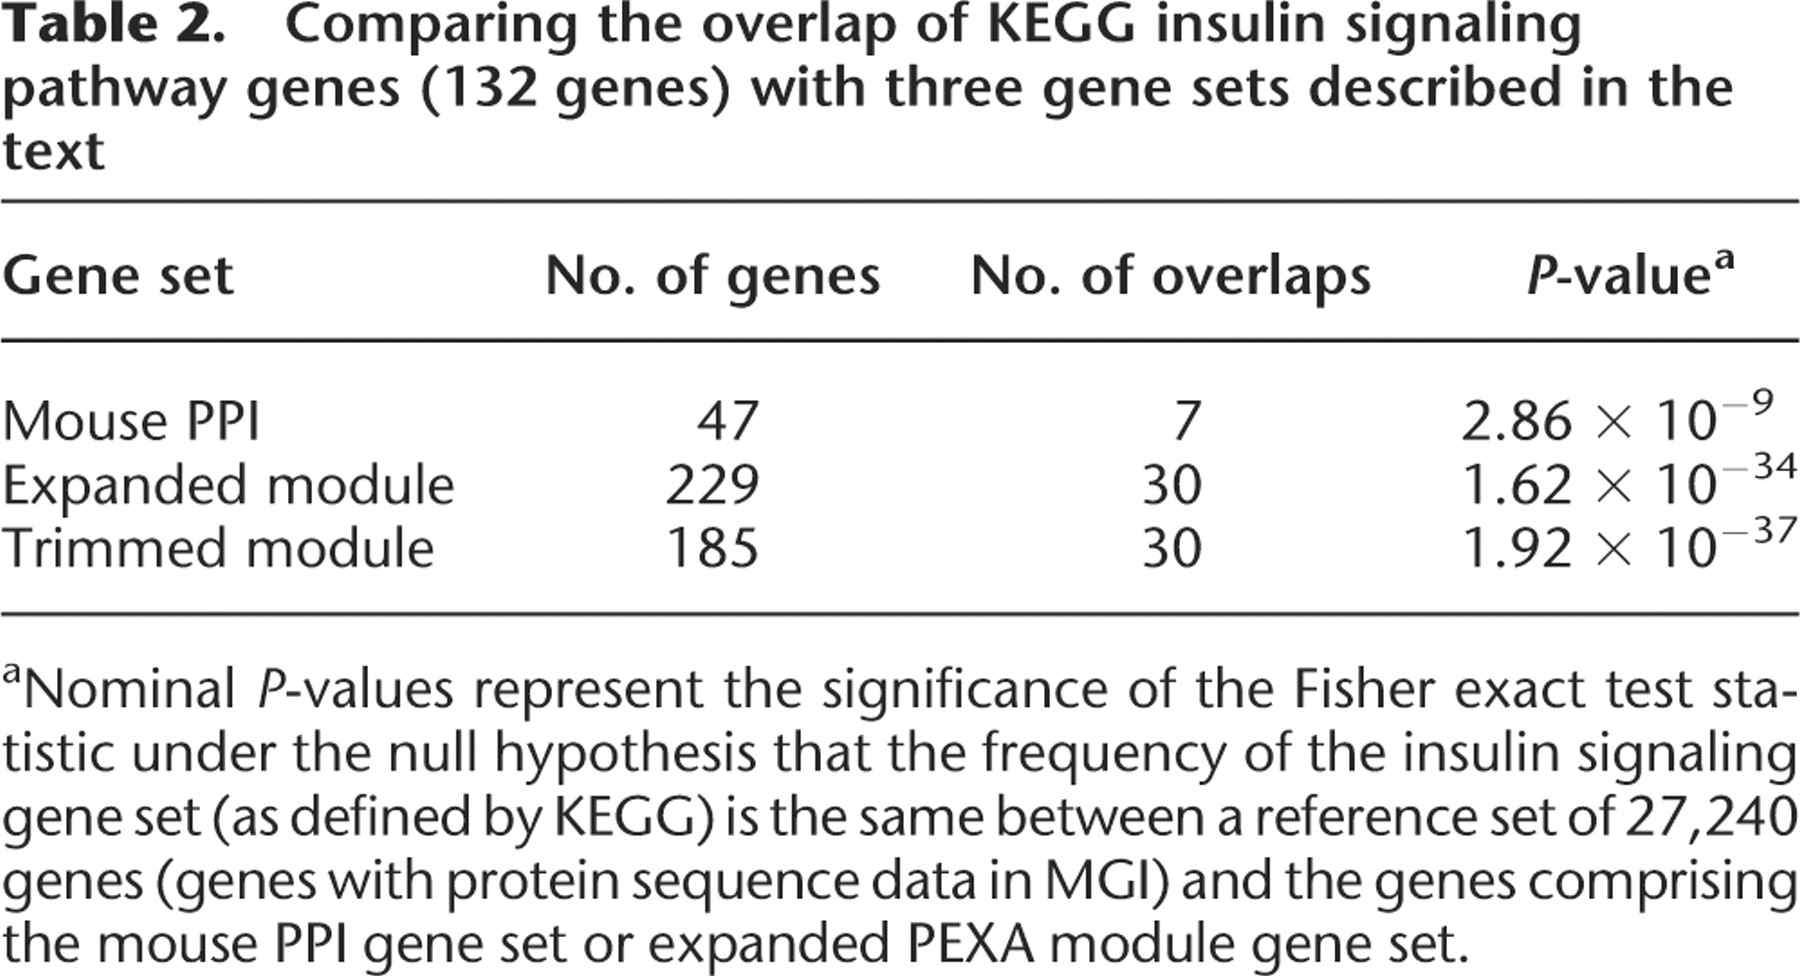
Table 2.
Comparing the overlap of KEGG insulin signaling pathway genes (132 genes) with three gene sets described in the text
Click on table to view larger version.
-
aNominal P-values represent the significance of the Fisher exact test statistic under the null hypothesis that the frequency of the insulin signaling gene set (as defined by KEGG) is the same between a reference set of 27,240 genes (genes with protein sequence data in MGI) and the genes comprising the mouse PPI gene set or expanded PEXA module gene set.


