
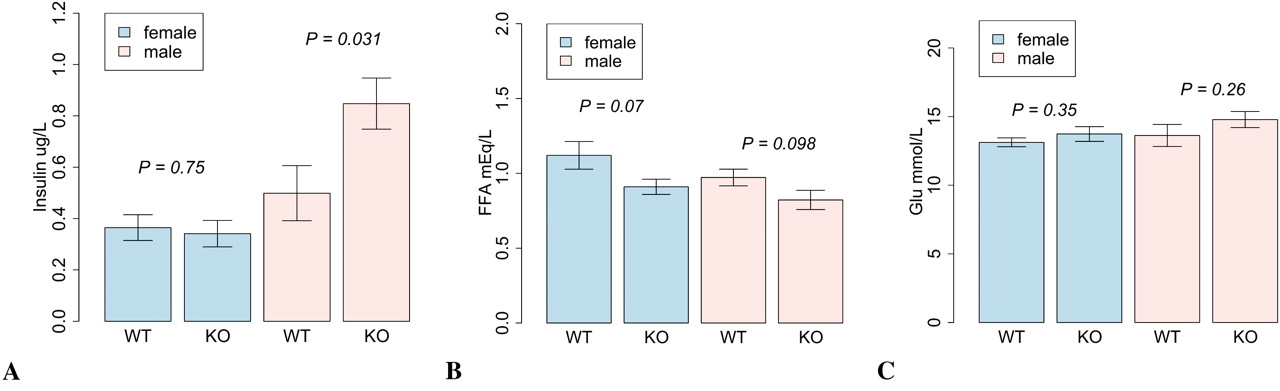
Figure 5.
Phenotypic differences between S1pr2−/− and S1pr2+/+ mice. Blood samples were collected from four groups of mice: male S1pr2+/+, male S1pr2−/−, female S1pr2+/+, and female S1pr2−/−. Mice were on a standard chow diet after weaning until 11 wk of age and then were switched to a high-fat diet until 21 wk of age. Results shown are for blood samples collected at 21 wk of age after a 4-h fast: (A) plasma insulin levels, (B) plasma free fatty acid levels, and (C) plasma glucose levels.


