
Abstract
Insulin resistance is one of the dominant symptoms of type 2 diabetes (T2D). Although the molecular mechanisms leading to this resistance are largely unknown, experimental data support that the insulin signaling pathway is impaired in patients who are insulin resistant. To identify novel components/modulators of the insulin signaling pathway, we designed siRNAs targeting over 300 genes and tested the effects of knocking down these genes in an insulin-dependent, anti-lipolysis assay in 3T3-L1 adipocytes. For 126 genes, significant changes in free fatty acid release were observed. However, due to off-target effects (in addition to other limitations), high-throughput RNAi-based screens in cell-based systems generate significant amounts of noise. Therefore, to obtain a more reliable set of genes from the siRNA hits in our screen, we developed and applied a novel network-based approach that elucidates the mechanisms of action for the true positive siRNA hits. Our analysis results in the identification of a core network underlying the insulin signaling pathway that is more significantly enriched for genes previously associated with insulin resistance than the set of genes annotated in the KEGG database as belonging to the insulin signaling pathway. We experimentally validated one of the predictions, S1pr2, as a novel candidate gene for T2D.
Insulin deficiency and resistance are the two major causes of type 2 diabetes (T2D) (Turner et al. 1979). Insulin resistance is tightly related to the functional state of the insulin signaling pathway together with several other cellular processes like insulin secretion and inflammation (Pessin and Saltiel 2000; Clee et al. 2006; Draznin 2006; Solinas et al. 2007). Previous studies have shown that knocking out components in the insulin signaling pathway leads to insulin resistance in mice (Araki et al. 1994; Tamemoto et al. 1994). While a few key components of the pathway have been identified (e.g., insulin receptor and insulin receptor substrates), a clear global picture has yet to emerge (Taniguchi et al. 2006). It is of further note that almost all of the T2D genes identified in the human genome-wide association studies (GWAS) and extensively replicated appear to be related to beta cell function, not insulin resistance (Pascoe et al. 2007; Scott et al. 2007). Therefore, novel approaches are required to enhance our understanding of the mechanisms of insulin resistance.
The recently developed RNAi technologies provide a way to interrogate the function of genes individually and in a high-throughput fashion with respect to biological functions, cellular processes, or other phenotypes of interest (Mello and Conte 2004). The high-throughput short interfering RNA (siRNA) screening technologies have gained in popularity over the past several years, and a plethora of large-scale screens have now been performed in various organisms, targeting different cellular processes and/or pathways (Berns et al. 2004; Boutros et al. 2004; Nollen et al. 2004; Lu et al. 2007). To identify novel components/modulators of the insulin signaling pathway, we designed siRNAs targeting over 300 genes known or predicted to associate with T2D traits and then tested the effects of knocking down these genes in an insulin-dependent anti-lipolysis assay in 3T3-L1 adipocytes. For 126 genes, significant changes in free fatty acid release were observed.
To properly interpret this type of data, a number of concerns have to be addressed regarding the quality of large-scale siRNA experiments. Off-target effects resulting from a given siRNA directly knocking down unintended target genes are now well established (Kulkarni et al. 2006). Because mismatches and gaps between small RNA and target RNA sequences can be well tolerated, small RNAs have been shown to have potentially hundreds of target sequences in the genome (Ma et al. 2006). In addition, the degree of knockdown of target genes by different siRNAs is typically highly variable, thus the actual silencing effect on a specific protein's activity is hard to estimate. As a result, follow-up studies have been viewed as critical for filtering out false-positive hits as well as recovering false-negative hits that result because the extent of knockdown of the target gene was not significant enough to achieve efficacy. Further analyses are also required to identify the underlying mechanisms of the cellular processes of interest. In particular, analyses at the pathway level are of high interest given the ultimate aim in large-scale siRNA screening experiments is to elucidate how genes interact to sense extra/intracellular signals and to perform complex cellular logic underlying complex biological processes (Moffat and Sabatini 2006).
To obtain a set of positive siRNA hits with higher confidence from our insulin resistance siRNA screen, we developed and applied a novel network method that elucidates the mechanisms of action for the true positive siRNA hits. This method also leads to an expanded set of genes predicted to be involved in insulin signaling, beyond those genes represented in the siRNA hit list. This is achieved by integrating known pathway relationships and experimentally determined protein–protein interactions to link true positive siRNA hits to networks of genes related to insulin signaling. Our analysis results in the identification of a core network underlying the insulin signaling pathway that is more significantly enriched for genes previously associated with insulin resistance than the set of genes annotated in the Kyoto Encyclopedia of Genes and Genomes (KEGG) database as belonging to this pathway. We experimentally validate one of the predictions, S1pr2, in this network as a novel candidate gene for T2D.
Results
To obtain a more comprehensive set of insulin pathway components/modulators, 313 genes were selected and targeted with siRNAs in cultured 3T3-L1 adipocytes as shown in Figure 1A,B. Diabetes- and obesity-related genes were pooled from several different sources: (1) genes supported as causal for diabetes- and obesity-related traits in published mouse crosses (Schadt et al. 2003; Chen et al. 2008), (2) genes involved in fatty acid beta-oxidation, based on experiment validations published in the primary literature, (3) orphan peptidases observed to co-express with known diabetes and obesity genes, and (4) genes associated with diabetes and obesity as determined by published data sets and primary reports in the literature. Genes that give rise to protein products that have a high druggability potential (Schoenborn et al. 2006) were identified from this set of diabetes- and obesity-associated genes, resulting in a set of 313 genes for siRNA screening. The majority of these 313 candidate genes (177 or 57%) were supported as causal for diabetes- and obesity-associated traits based on a previously developed integrative genomics procedure (Schadt et al. 2005). This procedure integrates genotypic, gene expression, and clinical trait data to test whether gene expression and clinical traits linked to common genetic loci are related in a causal, reactive, or independent fashion. We applied this procedure to liver and adipose gene expression data and plasma insulin, glucose, and free fatty acid levels monitored in previously described crosses constructed from the B6, DBA, and C3H strains (referred to here as the BXD and BXH crosses) (Schadt et al. 2003; Chen et al. 2008).
Selecting genes for the insulin resistance siRNA screen. (A) Global view of how 313 genes were selected for screening. Genes from multiple sources were considered and filtered based on whether their protein products could be targeted by small molecules. (B) Distribution of sources from which the 313 genes were selected. For example, 177 of 313 genes were selected because they were supported as causal for diabetes/obesity in an experimental cross population. (C) Distribution of the 313 genes with respect to five function categories: (1) G protein–coupled receptor (GPCR), (2) protease, (3) ion channel, (4) kinase/protease, and (5) other function. The numbers of genes in each category are provided after category names, where (+) stands for a positive siRNA hit and (−) denotes a negative siRNA hit.
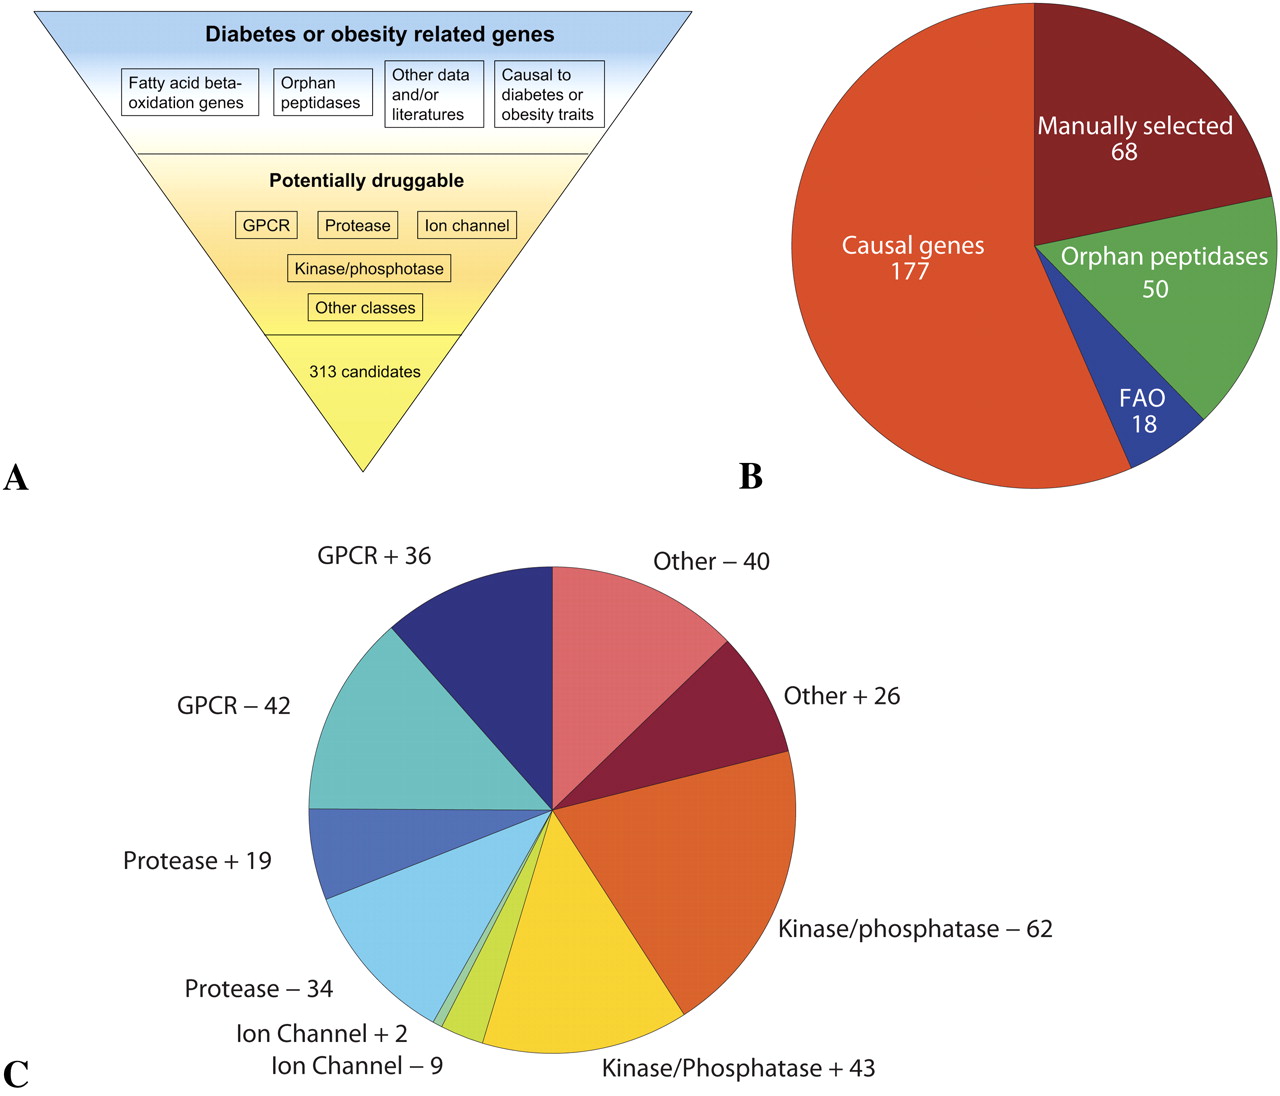
We screened each of the 313 genes identified above in an insulin-dependant anti-lipolysis reporting system in which free fatty acid (FFA) release was monitored in response to treatment with siRNAs designed against each of the target genes of interest (see Methods for more detail). Insulin-dependent FFA release is an indicator of insulin resistance (Yki-Jarvinen and Taskinen 1988; Gower et al. 2001). As a system becomes more insulin resistant, the amount of FFA release increases, given that the ability of the system to respond to insulin signaling is reduced. Therefore, in this assay, if reducing the activity of a given gene increases (decreases) FFA release, we can conclude that the gene has a putative role in insulin sensitization (resistance). Of the 313 genes screened via this siRNA assay, FFA release was significantly increased (decreased insulin sensitivity) or decreased (increased insulin sensitivity) for 126 (∼40%) of the genes, based on three repeats for each assay. We refer to these genes as siRNA (positive) hits regardless of the direction of the effect. It is of note that the fraction of positive hits observed in this study was much higher than previously reported whole genome screens, where such screens typically resulted in <10% of the genes targeted exhibiting a significant effect (Boutros et al. 2004; Nollen et al. 2004; Lu et al. 2007). The higher hit rate achieved in our study may reflect the strong bias toward biological relevance in the candidate gene selection process. While a direct comparison to these different studies is not possible given differences in biological processes that were targeted, in the experimental assays, in the RNAi designs, and in the statistical analyses for declaring hits, a within experiment comparison on groups of genes selected using different criteria does suggest that genes identified using the causality procedure were more likely to contain relevant pathway components/modulators (Supplemental Table S1; Supplemental materials). This is consistent with previous results we have achieved applying this procedure to identify and validate metabolic trait genes (Mehrabian et al. 2005; Schadt et al. 2005; Chen et al. 2008).
Some of the siRNA hits we observed are well known insulin signaling pathway components or modulators, including Insr, Akt1, Akt2, and Pten (representing all four positive controls used to develop the screen), while the vast majority are not well supported as genes involved in insulin signaling. Since our assay relied on insulin-dependent anti-lipolysis as the reporting system, some hits may be more closely related to lipolysis than to insulin signaling. Pnpla2, a gene recently identified as a key enzyme in triacylglycerol metabolism, is one such example (Lake et al. 2005; Zechner et al. 2005) of genes involved in insulin-dependent anti-lipolysis (Kim et al. 2006). Aside from the known insulin pathway genes and lipolysis-related genes, the siRNA hits are distributed across a number of categories reflecting different protein characteristics, including kinases, phosphatases, and G protein–coupled receptors (GPCRs) (Fig. 1C).
The identification of hundreds of genes supported as causal for diabetes-associated traits from experimental mouse populations suggested that large networks of genes were driving disease-associated traits. The high rate of validation of these predictions in the siRNA screen further supports that networks, as opposed to simple, linearly ordered pathways, drive complex system behavior (Chen et al. 2008). To further increase confidence in the siRNA results and to provide greater insights into the mechanisms of the underlying signaling logic, we developed and applied a novel network-based algorithm (the Pathway Expansion Analysis, or PEXA) to these data. The primary assumption underlying PEXA is that siRNA hits for a common cellular phenotype are more likely true positives if they interact and cluster together in the protein–protein interaction (PPI) network. Instead of taking an unsupervised approach to search for subnetworks enriched for siRNA hits in the PPI network, an approach originally proposed for finding differentially expressed gene-enriched modules (Ideker et al. 2002; Liu et al. 2007), PEXA leverages classic pathway information deposited in KEGG (Kanehisa et al. 2004) to guide the search in the PPI network. The ultimate output of this procedure is an interaction network enriched for genes that are supported as causal for phenotypic changes of interest in response to knockdown with siRNAs.
Constructing a core network seeded by siRNA hits
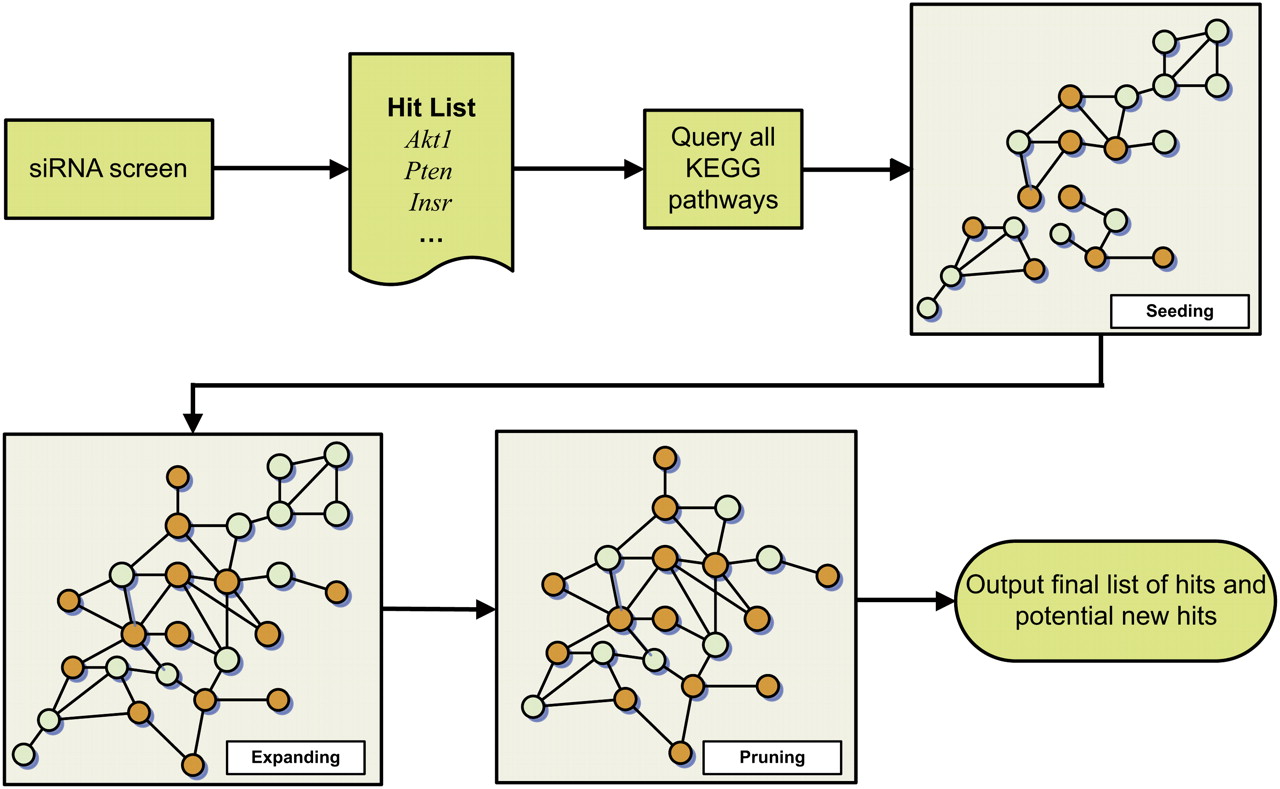
Because the outputs of siRNA screens are generally noisy, further analyses or follow-up experiments are required to confirm whether the observed hits are true with respect to the intended target. In addition to analyzing the reliabilities of individual hits, we were also interested in obtaining insights into the possible mechanisms of how these genes potentially interact to perform the complex logic embedded in the system with respect to insulin signaling. Therefore, we combined KEGG pathways and PPIs to increase our confidence in the relevance of the siRNA hits and to elucidate the networks in which these genes operate. In this insulin signaling context the PEXA method consisted of the following steps: (1) identifying genes from the insulin-dependent anti-lipolysis siRNA screen (referred to here as the hit list), (2) querying genes in the siRNA hit list against the KEGG pathway database to identify the initial seeding paths for the networks underlying the insulin signaling process, (3) expanding the seeding pathways into networks based on PPI data, and (4) pruning the expanded network to eliminate components that are not supported by the siRNA screening results, resulting in a compact subnetwork that underlies the biological process of interest and that is enriched for the siRNA hits (Fig. 2).
Flow diagram for the PEXA network reconstruction process. This reconstruction process consists of four steps: (1) perturbing genes of interest using siRNA to identify those that produce the desired phenotype (referred to here as the hit list); (2) querying through all the pathways in the KEGG database with the hit list to identify seeding paths; (3) expanding the seeding paths using PPI data to obtain a more coherent network relating to the biological process of interest (insulin signaling in this case); and (4) pruning the network obtained in step 3 to enhance the biological coherence of the network with respect to the biological processes of interest. In the hypothetical networks depicted in this figure, the orange nodes correspond to genes in the siRNA hit list, while the blue nodes are supported by the KEGG and/or PPI data as operating in the same part of the network as the hit list genes.
Seeding the network with KEGG pathways
Since KEGG contains manually curated interactions, it is ideal for initiating the search process (seeding). A pathway (e.g., insulin signaling pathway), denoted as Pi, consists of a collection of nodes Ni and edges Ei. Edges can be either directed (such as phosphorylation) or undirected (such as PPI), depending on the nature of the interaction. For the set of positive siRNA hits S, we defined
 as the intersection of S and nodes Ni in the pathway Pi. If the number of elements in
 , denoted as |
 |, was ≥ 2, we searched for all possible paths in Pi that connected ui and vi, for
 and ui ≠ vi. We call such paths seeding paths, which serve as the backbone for the network expansion described in the following step. In this case we stored only the edges and associated nodes, as opposed to all possible paths. Therefore, the total number of edges that needs to be stored is bounded by
 , which is small compared to the theoretical upper bound on the number of possible paths.
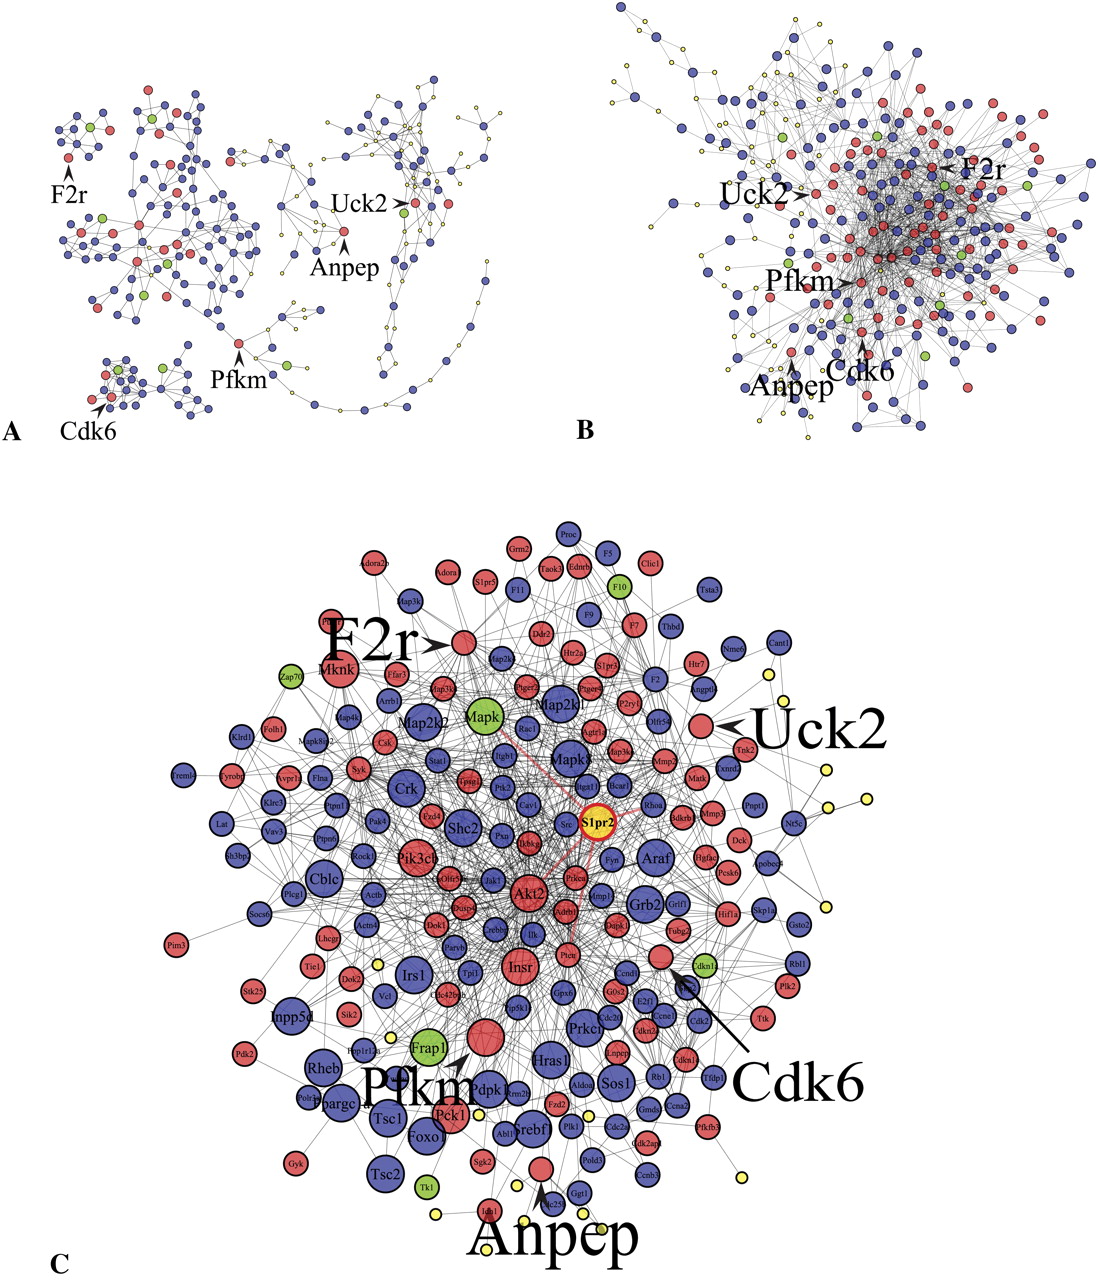
The seeding paths generated from the siRNA hits and KEGG pathways are shown in Figure 3A. Several pathways are identified by the siRNA hit genes, forming a series of disjointed subnetworks. Not surprisingly, the insulin signaling pathway interacts with branches of several other KEGG pathways and forms the largest connected subnetwork. While multiple pathways have been pulled in as a result of the seeding process, overall the number of siRNA hits contained in all seeding paths is only 24 (out of the 126 hits). This limited overlap is mostly due to the limited coverage of the KEGG database. It is of note that nine of the 187 genes from the siRNA screen that were tested but that gave no response (negatives in the screen) were also included in the seeding paths, pulled in as members of the pathway as defined by KEGG, illustrating the advantage of incorporating known pathway members to help link the set of positive hits from the siRNA screen.
Using PEXA to construct the insulin resistance networks. Red nodes represent genes in the siRNA hit list, green nodes represent genes that were screened but that are not in the siRNA hit list, and blue nodes represent genes that were not screened. (A) The siRNA hits (red nodes) serve as seeds for building up the seeding paths based on pathways represented in the KEGG database. (B) The seeding paths depicted in A are expanded and joined together using PPI data to form a single network. (C) After pruning we obtain a core network of genes enriched for siRNA hits. Larger sized nodes represent genes in the KEGG insulin signaling pathway, while the smaller sized yellow nodes represent small molecules in the KEGG database. The red edges represent interactions between S1pr2 (gold node) and its neighbors. We arbitrarily selected a few nodes and labeled them using a large font size to indicate the interdependency among the three plotted networks.
Iterative expansion of seeding paths using protein–protein interactions
With the seeding paths in hand, we expanded these paths using the genome-wide protein interaction network. The aim in this step was to include siRNA hits that interact with the seeding paths via the PPI network. Again, our primary assumption in the expansion step is that if an siRNA hit has interactions with the seeding paths, then it is more likely to be a true hit and the pathway to which it connects is more likely to be relevant to the system under study. The comprehensive PPI network was assembled from multiple databases (see Methods for more detail). Because the initial gene set for the siRNA screen was identified based mainly on gene expression profiles, we did not use the gene expression data to help differentiate true from false-positive siRNA hits, although coexpression networks could be used in a similar fashion to the PPI data for siRNA screens of genes identified independently of the expression data. Here, the PPI data were used for a “stepwise” expansion as follows. If a siRNA hit fell outside of all seeding paths, but had at least one direct interaction in the PPI network with a node in a seeding path, then we expanded the seeding paths by including the siRNA hit gene. The expansion was continued iteratively until no extra siRNA hits could be added. By performing this type of “stepwise” expansion rather than expanding aggressively (e.g., allowing siRNA hits not represented in the network to connect to seeding paths via non-siRNA hits), a more compact and presumably more reliable subnetwork was obtained. The expanded network resulting from this process is shown in Figure 3B.
Pruning the expanded network
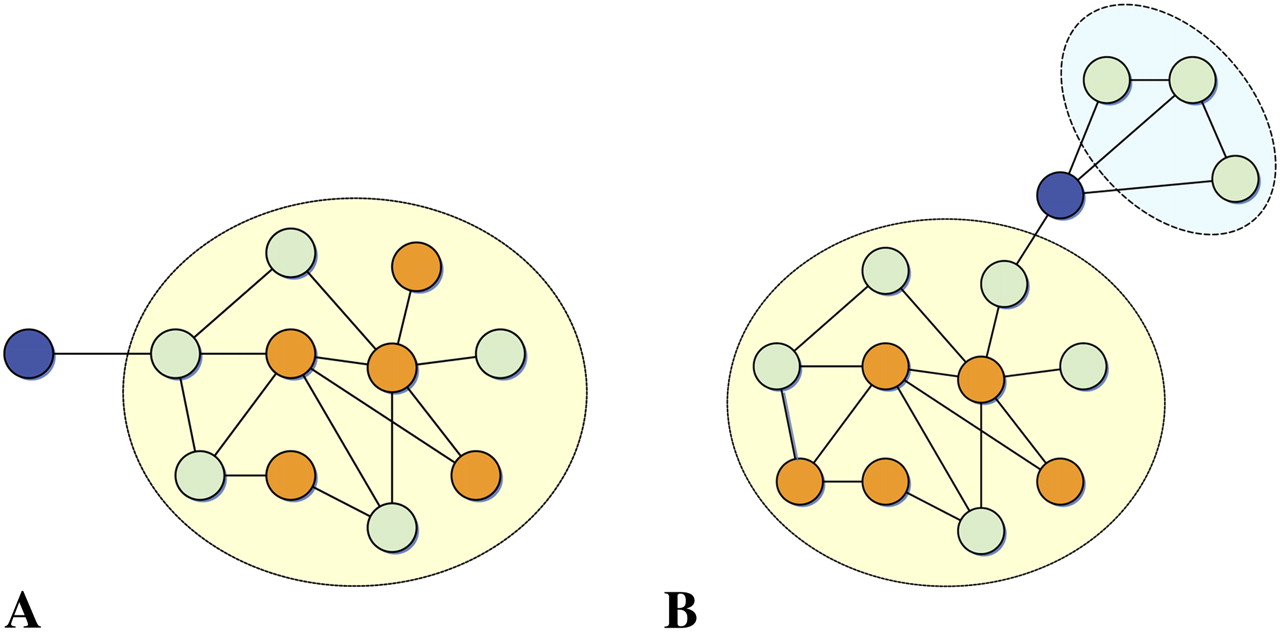
After the expansion step we observed that the siRNA hits form a connected network, while other parts of the network contained no siRNA hits. Clearly, genes that were not tested by the siRNA screen or genes corresponding to negative siRNA hits could also be supported as participating in biological processes of interest if they were strongly connected to other siRNA hits. In contrast, regions of the network containing only non-siRNA hits are not supported by the experimental data and so are considered lower confidence and lower in priority for experimental follow-up studies. Therefore, to automatically derive the core module enriched for siRNA hits, we pruned nodes and their corresponding edges if (1) the node was a non-siRNA hit gene that had only one connection to the rest of the network, and it was via an interaction with another non-siRNA hit gene, or (2) after removing a non-siRNA hit gene the node belonged to a subnetwork consisting only of non-siRNA hits (Fig. 4). The full pruning algorithm is described in Supplemental Box 1. The pruning procedure is conservative as none of the siRNA hits can be removed during the process. The final network after pruning was comprised of 202 nodes (185 genes and 17 small molecules), with 79 positive siRNA hits and six negative siRNA hits (Fig. 3C). Because the network after pruning is connected and compact, it is referred to here as PEXA module. The PEXA module is not only more significantly enriched for siRNA positive hits (adjusted P = 0.001), but it is also enriched for genes whose knockouts lead to insulin resistance and abnormal glucose tolerance phenotypes (Fisher exact test P = 5.8 × 10⁻⁷), supporting their roles as putative insulin signaling modulators.
PEXA pruning step. Two types of “superficial” nodes were identified for pruning: (A) nodes that are not siRNA hits and that have only one connection to the network via an interaction with another non-siRNA hit gene, and (B) nodes that are part of a network component comprised solely of non-siRNA hit genes and connected to the network via a non-siRNA hit gene. In the example networks depicted, blue nodes represent the superficial nodes, orange nodes represent siRNA hits, and green nodes represent non-siRNA hit nodes incorporated from either the KEGG database or PPI data. The superficial nodes and subnetworks containing no siRNA hits to which they connect are removed as part of the pruning process.
Assessing the significance of the PEXA module
Two permutation tests were performed to further validate that (1) siRNA screen results were at least partially informative, and (2) PEXA preserved and enhanced the information contained in the siRNA screen results. If the genes identified as siRNA hits were not coherent with respect to pathways associated with insulin signaling, then we would not expect them to be more enriched in the final network than by chance, given that connections in the network were driven by protein interactions. The null hypothesis in this case is that the network is not further enriched for siRNA hit genes beyond what we would expect by chance. To test whether there was significant enrichment, we empirically estimated the null distribution by randomly selecting 313 genes from all of the genes covered by the PPI network and randomly labeled 126 of them as “siRNA hits” and the rest as “siRNA non-hits.” After applying PEXA on these gene sets, we counted the numbers of “siRNA hits” and “siRNA non-hits” in the output network for each set. We performed 1000 permutation tests in total. Because the set of 313 genes for the permutation test were randomly selected, the “siRNA hits” are less tightly connected in the resulting PEXA networks. The number of “siRNA hits” in the final network over the 1000 permutation runs varies significantly, as shown in Supplemental Figure 2A. The P-value for observing equal or larger numbers of siRNA hits in the final network than we observed in the network depicted in Figure 3C is 0.003.
Because the original set of 313 genes screened via siRNA was not randomly selected, we performed a second set of permutations by resampling from the set of 313 genes that were originally screened via the siRNA assay. We randomly assigned 126 out of the 313 screened genes as hits and then constructed networks using PEXA. As the 313 genes share coherent biological processes, the numbers of “siRNA hits” and “siRNA non-hits” in the final networks based on 1000 permutations were proportional, as shown in Supplemental Figure 2B. The results from the siRNA screen based on the observed data are seen to be dramatically different from all of the permutation runs. The probability that the observed run belongs to the null distribution estimated via the permutations is 1.2 × 10⁻²⁵.
Comparing the derived network with other biological gene sets
To test the performance of PEXA and validate the coherence and biological relevance of the derived PEXA network, we conducted several comparisons among different gene sets. First we carried out a pathway gene set enrichment test for the original 313 screened genes, the 126 siRNA hits, and the 185 genes in the final PEXA module. The top 10 enriched KEGG pathways (of the 181 pathway gene sets detected in total) are listed for these three data sets in Table 1. As expected, the original genes selected for screening were not random but biased toward a number of pathways. For example, the neuroactive ligand receptors, of which many are G protein–coupled receptors, were significantly enriched in this set. Of particular note for the original set of 313 genes selected for screening is that the insulin signaling pathway ranked near the bottom of the top 10 most enriched pathways. For the genes reported as siRNA hits, the insulin signaling pathway was among the most highly ranked pathways, suggesting that the insulin-dependent anti-lipolysis siRNA screen carried out in this study indeed favored genes involved in insulin signaling. For the genes in the PEXA module, the insulin signaling pathway was the second most highly ranked pathway, and, in fact, was greater than fourfold more enriched than the original set of 313 genes selected for the siRNA screening. The top ranked pathway enriched in the PEXA module was the focal adhesion pathway, which is of interest given that free fatty acid and expression of adhesion molecules are tightly related (Jensen 2006). Although the output of PEXA is dependent on the input set of genes, a limitation of the partial genome screening carried out in this study, the method did correctly prioritize the relevant pathways associated with the biological process under investigation.
List of the top 10 most enriched KEGG pathways for 313 screened genes, 126 siRNA hits, and 185 module genes, respectively
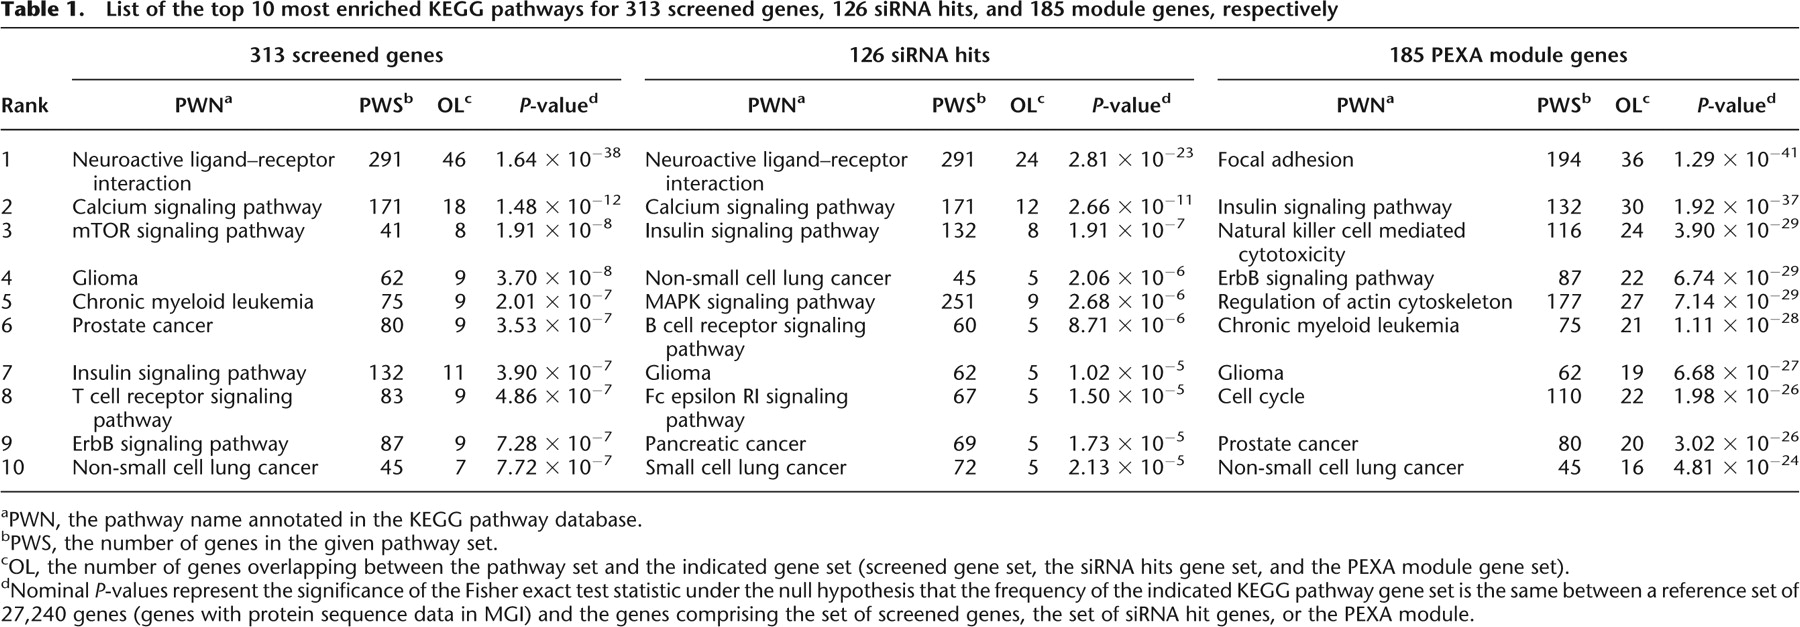
[i] aPWN, the pathway name annotated in the KEGG pathway database.
[ii] bPWS, the number of genes in the given pathway set.
[iii] cOL, the number of genes overlapping between the pathway set and the indicated gene set (screened gene set, the siRNA hits gene set, and the PEXA module gene set).
[iv] dNominal P-values represent the significance of the Fisher exact test statistic under the null hypothesis that the frequency of the indicated KEGG pathway gene set is the same between a reference set of 27,240 genes (genes with protein sequence data in MGI) and the genes comprising the set of screened genes, the set of siRNA hit genes, or the PEXA module.
The second comparison we carried out involved comparing gene sets generated by different computational algorithms, to analyze the performance of these algorithms against the PEXA method. The first set was derived by considering siRNA hits that interacted with each other in the PPI network (referred to here as the mouse PPI set). The second set was constructed from an intermediate step of the PEXA method and consisted of the network prior to the pruning step. Studying this gene set allowed us to determine whether the pruning step was effective. The third set we considered was the PEXA generated module. We also considered the set of siRNA hits and their direct neighbors in the PPI network. However, because >2000 genes were included in this set, we decided it was effectively useless and excluded it from further comparison.
We tested whether the three gene sets just described were enriched for genes in the insulin signaling pathway defined in the KEGG database. The insulin signaling pathway is the most relevant cellular process related to our study, given the siRNA screen designed for this study was focused on this process. Although this pathway was provided as input into the PEXA method, it was provided anonymously along with 180 other pathways. Therefore, we considered this a fair comparison given the mouse PPI gene set was not specifically informed by the insulin signaling pathway during its construction. As shown in Table 2, the network generated from PEXA has a much larger overlap (a fourfold increase) with the insulin signaling pathway than the mouse PPI gene set. Furthermore, the PEXA module compared to the PEXA network constructed prior to the pruning step is more significantly enriched for genes in the insulin signaling pathway. These enrichments again validate the utility of the PEXA method.
Comparing the overlap of KEGG insulin signaling pathway genes (132 genes) with three gene sets described in the text
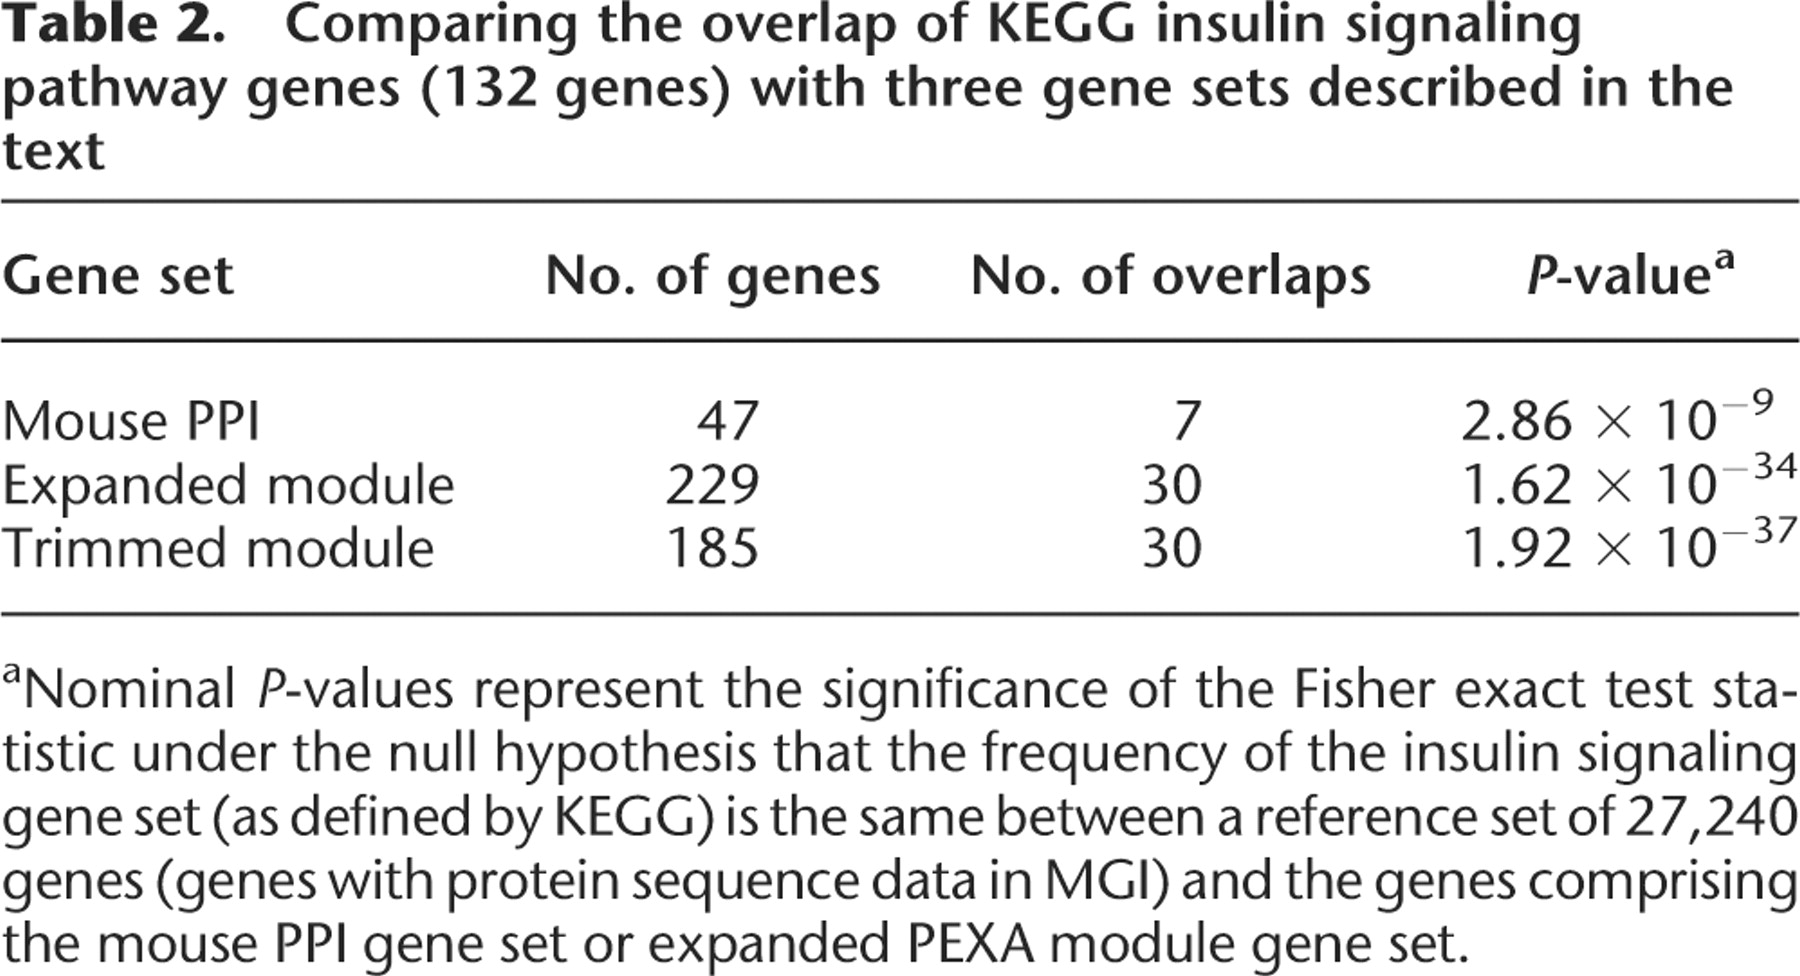
[i] aNominal P-values represent the significance of the Fisher exact test statistic under the null hypothesis that the frequency of the insulin signaling gene set (as defined by KEGG) is the same between a reference set of 27,240 genes (genes with protein sequence data in MGI) and the genes comprising the mouse PPI gene set or expanded PEXA module gene set.
To further establish the power of the PEXA method to lead to biologically relevant networks, we compared genes in the derived network with the mouse knockout results extracted from the Mouse Genome Informatics (MGI) database (Eppig et al. 2005). We combined two sets of genes: (1) knockout models with an insulin resistance phenotype, and (2) knockouts with abnormal glucose tolerance phenotypes. Based on these criteria we identified 136 unique genes. We then tested different gene sets related to the PEXA network we constructed to assess whether the set of 136 genes associated with insulin signaling phenotypes was overrepresented in these different gene sets. The overlap between the knockout gene set and the original set of siRNA hits was only four (e.g., Insr and Akt2), which is only marginally significantly enriched with respect to the 313 genes tested in the siRNA screen as the background set (Fisher exact test P = 1.1 × 10⁻²). On the other hand, the overlap with the PEXA module is 10 (Cav1, Crebbp, Prkci, Mapk8, Irs1, Ppargc1a, and the original four genes), an enrichment that is unlikely to have happened by chance (Fisher exact test P = 5.8 × 10⁻⁷). Given these results, we can conclude that the PEXA method generated a list of genes significantly more enriched for genes associated with insulin resistance and glucose homeostasis than the set of genes that produced positive hits from the siRNA screen.
Even though the overlap between the network we derived and the genes causing insulin-related phenotypes is significant, most of the genes validated as causing insulin-related phenotypes were not in the PEXA module. One possible explanation is that these genes may affect insulin phenotypes via regulating the PEXA module. To test this we examined adipose gene expression signatures for four gene knockout models that we had access to and which were validated as impacting diabetes-associated traits, to assess whether a significant number of genes in the PEXA module responds to strong perturbations (knockout) of genes that are not in the module. We defined the adipose gene expression signatures for Alox5, Lrp5, and Cnr1 mouse knockout models and for the Mc3r/4r double knockout model as genes that were differentially expressed (at the 0.01 significance level, see details in Supplemental Methods) between the knockout and wild-type mice for each model. The adipose signatures were then compared with the KEGG insulin signaling pathway and with our derived network. Three of the four knockout signatures significantly overlapped with the KEGG insulin signaling pathway (at the 0.01 significance level). On the other hand, all four of the knockout signatures significantly overlapped the PEXA module and the significance levels were much greater, suggesting that each of these genes may potentially interact with insulin signaling and glucose homeostasis maintenance (Supplemental Table 2). For each of the knockout models the MGI database indicated phenotypic effects on diabetes-associated traits like plasma insulin levels, plasma glucose levels, and impaired glucose tolerance. For Lrp5 KO model, the P-value for overlap between the knockout signature and KEGG insulin signaling pathway was 0.19. However, the overlap between the knockout signature and PEXA module was 2.1 × 10⁻⁶. Therefore, while the knockout phenotype could not be strongly associated with diabetes based on the KEGG insulin signaling pathway, it was easily predicted based on its impact on the PEXA module.
Identifying and validating S1pr2 as a candidate T2D gene
The gold standard for validating models predicted as causal for complex phenotypes like insulin signaling is prospective validation. Because it is not yet feasible to test in vivo all genes supported as causal in our derived network, we used a number of criteria to prioritize genes for validation: (1) The gene had to reside in the PEXA module; (2) the gene had to correspond to a positive siRNA hit; (3) the gene had to be supported as causal for diabetes- and obesity-related traits in the previously described BXD (Schadt et al. 2003, 2005) and BXH (Chen et al. 2008) crosses; and (4) the gene knockout model had to exist in Deltabase. Nine genes were identified after applying these filters and, by further restricting to genes belonging to GPCR family (for convenient targeting with small molecules) and highly expressed in adipose tissue, we obtained only two genes in the PEXA module, namely, S1pr2 and P2ry1. P2ry1 expression levels in liver and adipose tissues ranked low among all tissues, whereas expression levels for S1pr2 were high in islets, liver, and adipose tissues. Therefore, we selected S1pr2 for extensive phenotypic validation.
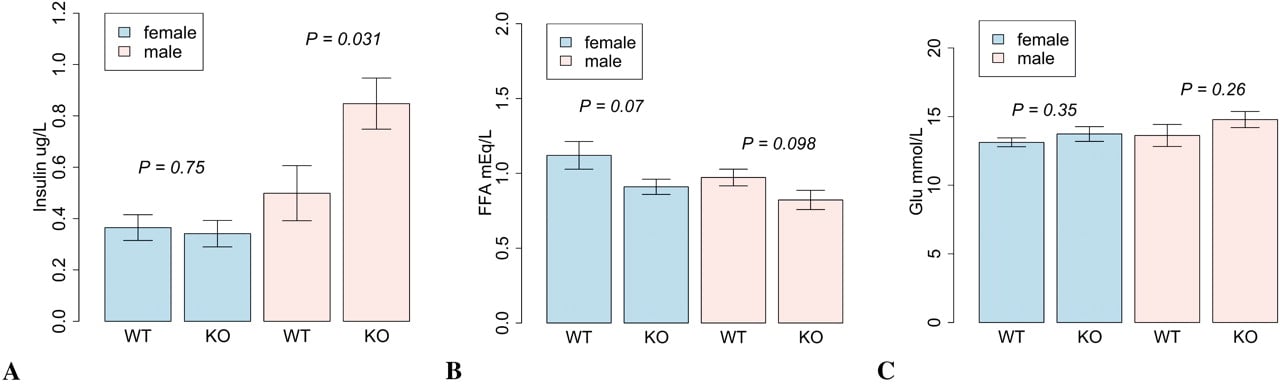
S1pr2 is known to bind sphingosine-1-phosphate, signal via G protein to elevate intracellular calcium, and to play an important role in neuronal excitability (An et al. 2000; MacLennan et al. 2001). Previous studies have shown that S1pr2 transduced S1P-evoked signaling events relevant to cell proliferation and survival, including activation of the ERK/MAP kinases (An et al. 2000). However, S1pr2 has not previously been associated with diabetes traits. Therefore, S1pr2−/− knockout mice were compared with wild-type littermate controls for blood insulin, glucose, and FFA levels. Each group was comprised of nine males and nine females. Mice were placed on a chow diet after weaning until 11 wk of age and then switched to a high-fat, Western diet until 21 wk of age, at which time blood samples were collected after a 4-h fast. As shown in Figure 5, plasma insulin levels in the male knockout mice were significantly increased (t-test P = 0.03), consistent with the prediction that this gene may modulate insulin signaling phenotypes. Although FFA release increased when S1pr2 was knocked down in 3T3-L1 adipocytes, the plasma FFA levels remained unchanged in the S1pr2 mouse KO model. This may suggest the existence of certain compensatory mechanisms operating in the whole animal that prevent FFA from increasing.
Phenotypic differences between S1pr2−/− and S1pr2+/+ mice. Blood samples were collected from four groups of mice: male S1pr2+/+, male S1pr2−/−, female S1pr2+/+, and female S1pr2−/−. Mice were on a standard chow diet after weaning until 11 wk of age and then were switched to a high-fat diet until 21 wk of age. Results shown are for blood samples collected at 21 wk of age after a 4-h fast: (A) plasma insulin levels, (B) plasma free fatty acid levels, and (C) plasma glucose levels.
Discussion
We performed a siRNA screen on 313 genes to test for insulin signaling phenotypes and found more than one hundred candidate genes supported as having putative role in insulin signaling. To help increase confidence and to enhance the overall coverage of genes involved in processes associated with insulin signaling, we developed the pathway expansion analysis (PEXA). This method leverages the KEGG pathway database and PPI data as orthogonally generated sources of information that can be used to identify the signal in noisy siRNA screening data sets. Application of this method to our siRNA screening data resulted in the identification of a core module of genes interacting with known insulin signaling pathways. This new view of the insulin signaling network enhances our previous understanding of this important pathway and provides a meaningful list of genes to pursue in follow-up studies. We objectively identified one of the genes in this network, S1pr2, that was more strongly supported as causal for insulin resistance phenotypes and experimentally validated this prediction in a mouse knockout model. As a generalized tool, PEXA can be applied to other RNAi screening experiments to help elucidate the underlying mechanisms driving phenotypes of interest.
Compared with PPIs derived from high-throughput technologies, the KEGG database contains fewer interactions but these interactions are of higher quality. In addition, genes in the KEGG database and their interactions are grouped and ordered as pathways, where the topologies of such pathways provide extra, important information compared to the unordered lists of interactions represented in the PPI data. One common analysis strategy, gene set enrichment analysis (GSEA), tests sets of genes comprising pathways or other annotated gene sets (Subramanian et al. 2005) to assess whether they are significantly enriched for an input set of genes of interest. This type of test is valuable but provides no direct information on how input genes interact in the tested pathway. We have demonstrated that the manually curated biological pathways comprising the KEGG database are extremely helpful for elucidating complex experimental data. Of course, we expect that any given researcher may generate their own best prior knowledge of any number of pathways, in addition to those represented in KEGG; our method places no restriction on what pathway sets can be used.
Based on the module we obtained from the PEXA method, it appears that insulin signaling may be more complicated than what is presently represented in the KEGG database. However, due to the incompleteness and presumably low quality of the mouse PPI data, we would expect PEXA to have missed some insulin signaling modulators or made false-positive calls. Therefore, the new view our network provides should not be expected to fully reflect the complete network of genes associated with this biological process. Further, in practice experimentally determined interactions normally reflect different levels of experimental support. As a result, probabilistic modeling of the PPI network could significantly enhance network accuracy in this case, as we have shown in other contexts (Zhu et al. 2008). We aim to consider such developments in future work to improve PEXA. Nevertheless, the siRNA screen that generated the raw information upon which the PEXA algorithm was based and the follow-up network analysis significantly extend our understanding of the traditional insulin signaling pathway, and provide us with a new starting point for future explorations.
Despite our success with the PEXA method, several important questions still remain. First, the PEXA module we identified covers only part of the insulin pathway components/modulators, given our siRNA screen was restricted to 313 genes. Therefore, the PEXA module represents a lower bound for genes involved in this process. In fact, only 10 of the 136 genes represented in the MGI mutant database that gave rise to phenotypes related to insulin or glucose tolerance were included in our network (although this network is still significantly enriched for genes in this knockout set). To obtain a more global view of this network, a genome-wide siRNA screen would undoubtedly be helpful. Second, we are still far away from understanding the complex logic embedded in mammalian systems that modulates insulin signaling phenotypes. For example, the network we derived cannot be used to predict the effect of perturbing a given gene (e.g., will knocking a given gene down up- or down-regulate FFA release). This type of information is essential if we are to develop a detailed understanding of the system. Developing additional high-throughput technologies like genome-wide phosphorylation assays as well as novel methods for incorporating these data with existing data sets would significantly enable systems biology efforts to construct models that predict complex system behavior (Olsen et al. 2006; Dong et al. 2007; Sahin et al. 2007). The availability of these new high-throughput data types is on the horizon and will enable efforts to gain much deeper insights into complex living systems (Yeang et al. 2004; Janes and Yaffe 2006; Ivakhno and Armstrong 2007; Martin et al. 2007; Ourfali et al. 2007; Villen et al. 2007). Lastly, although we have generated a general picture for the network underlying insulin signaling, it was derived from a mouse cell line. Even if we assume that the mouse network is similar to the human network, and even if we ignore the difference between the in vitro and in vivo networks, specific efforts will be required to pinpoint the actual causal genes for insulin resistance in human populations, a necessary step for developing therapies for T2D that impact human health.
Methods
Insulin-dependent anti-lipolysis based siRNA screen
The anti-lipolysis screen was developed using 3T3-L1 cells that had been differentiated as described before (Thompson et al. 2004). Small interfering RNAs (siRNA) were obtained from Dharamcon per vendor's design. For each gene, three unique siRNAs targeting different regions of the gene were pooled together. The adipocytes were transfected with 100 nM pooled siRNA for 48 h while the cells were induced with 1 nM insulin at the same time. Free fatty acid (FFA) release was measured 4 d after transfection. FFA release from cells transfected with target-specific siRNAs was compared with cells transfected with control siRNAs. For each gene, three replicates were measured using the same pooled siRNA. For one of the replicate, the gene was flagged if FFA release changed significantly (t-test P < 0.05). A gene was considered a siRNA hit if two out of three replicates showed same significant effect.
Protein–protein interaction and KEGG pathway data
The set of mouse PPIs was obtained by integrating several public (BIND, BioGRID, HPRD, MINT, Reactome, DIP, and IntAct) and commercial (Ingenuity, Proteome, MetaBase, and NetPro) molecular interaction databases. Identifiers for the interacting genes identified in these different databases were mapped to Entrez Gene IDs to obtain a unified naming system. Duplicate interactions were removed, although the number of duplicate interactions was small, consistent with previous reports (Mathivanan et al. 2006). Mechanisms of interaction that were annotated as proteins involved in regulation (for example, “activates,” “inhibits,” and so on) were mapped to directed edges in the network. Mechanisms of interaction that were annotated as proteins involved in binding but with no regulatory effect (for example, “binds,” “covalent binding,” “ppi,” and so on) were mapped to undirected edges.
The KEGG pathways were obtained by parsing metabolic and signaling pathways contained in KEGG's public collection of “Kegg Markup Language” (KGML) files (Kanehisa et al. 2006). Each KGML file describes an individual pathway composed of a list of participating molecules, as well as a list of their relationships. The relationships were mapped to undirected edges if they were not regulatory (e.g., “binding”), or to directed edges if they were regulatory (e.g., “activation”). Because metabolic pathways can contain reactions (e.g., a substrate binds to an enzyme to produce a product), reactions were parsed to obtain two edges: (1) an undirected binding edge between the substrate and the enzyme, and (2) a directed edge between the enzyme and the product. Because KEGG signaling and metabolic pathways are more complete for human than mouse, we parsed the human KEGG pathways and then derived the mouse counterparts by mapping the human genes to the mouse orthologs.
Construction and characterization of S1pr2−/− and control mice
S1pr2−/− and control mice were obtained and licensed from National Institutes of Health and the knockout construction was reported previously (Kono et al. 2004). S1pr2−/− knockout mice and wild-type littermate controls were comprised of nine males and nine females, respectively. Mice were placed on a chow diet after weaning until 11 wk of age and then switched to a high-fat, Western diet until 21 wk of age, at which time blood samples were collected after a 4-h fast.
Acknowledgments
We thank Sajjad Qureshi and his colleagues for performing the siRNA screen experiments and the initial statistical analysis on the screen results.
References
- ↵S. An,Y. Zheng,T. Bleu,(2000) Sphingosine 1-phosphate-induced cell proliferation, survival, and related signaling events mediated by G protein-coupled receptors Edg3 and S1pr2. J. Biol. Chem. 275:288–296.
- ↵E. Araki,M.A. Lipes,M.-E. Patti,J.C. Bruning,B. Haag Iii,R.S. Johnson,C.R. Kahn,(1994) Alternative pathway of insulin signalling in mice with targeted disruption of the IRS-1 gene. Nature 372:186–190.
- ↵K. Berns,E.M. Hijmans,J. Mullenders,T.R. Brummelkamp,A. Velds,M. Heimerikx,R.M. Kerkhoven,M. Madiredjo,W. Nijkamp,B. Weigelt,(2004) A large-scale RNAi screen in human cells identifies new components of the p53 pathway. Nature 428:431–437.
- ↵M. Boutros,A.A. Kiger,S. Armknecht,K. Kerr,M. Hild,B. Koch,S.A. Haas,H.F.A. Consortium,R. Paro,N. Perrimon,(2004) Genome-wide RNAi analysis of growth and viability in Drosophila cells. Science 303:832–835.
- ↵Y. Chen,J. Zhu,P.Y. Lum,X. Yang,S. Pinto,D.J. MacNeil,C. Zhang,J. Lamb,S. Edwards,S.K. Sieberts,(2008) Variations in DNA elucidate molecular networks that cause disease. Nature 452:429–435.
- ↵S.M. Clee,B.S. Yandell,K.M. Schueler,M.E. Rabaglia,O.C. Richards,S.M. Raines,E.A. Kabara,D.M. Klass,E.T.K. Mui,D.S. Stapleton,(2006) Positional cloning of Sorcs1, a type 2 diabetes quantitative trait locus. Nat. Genet. 38:688–693.
- ↵M.-Q. Dong,J.D. Venable,N. Au,T. Xu,S.K. Park,D. Cociorva,J.R. Johnson,A. Dillin,J.R. Yates III(2007) Quantitative mass spectrometry identifies insulin signaling targets in C. elegans. Science 317:660–663.
- ↵B. Draznin,(2006) Molecular mechanisms of insulin resistance: Serine phosphorylation of insulin receptor substrate-1 and increased expression of p85α: The two sides of a coin. Diabetes 55:2392–2397.
- ↵J.T. Eppig,C.J. Bult,J.A. Kadin,J.E. Richardson,J.A. Blake,A. Anagnostopoulos,R.M. Baldarelli,M. Baya,J.S. Beal,S.M Bello,(2005) The Mouse Genome Database (MGD): From genes to mice—A community resource for mouse biology. Nucleic Acids Res. 33:D471–D475.
- ↵B.A. Gower,S.L. Herd,M.I. Goran,(2001) Anti-lipolytic effects of insulin in African American and white prepubertal boys. Obes. Res. 9:224–228.
- ↵T. Ideker,O. Ozier,B. Schwikowski,A.F. Siegel,(2002) Discovering regulatory and signalling circuits in molecular interaction networks. Bioinformatics 18:S233–S240.
- ↵S. Ivakhno,J.D. Armstrong,(2007) Non-linear dimensionality reduction of signaling networks. BMC Syst. Biol. 1:27, 10.1186/1752-0509-1-27.
- ↵K.A. Janes,M.B. Yaffe,(2006) Data-driven modelling of signal-transduction networks. Nat. Rev. Mol. Cell Biol. 7:820–828.
- ↵M.D. Jensen,(2006) Adipose tissue as an endocrine organ: Implications of its distribution on free fatty acid metabolism. Eur. Heart J. Suppl. 8:B13–B19.
- ↵M. Kanehisa,S. Goto,S. Kawashima,Y. Okuno,M. Hattori,(2004) The KEGG resource for deciphering the genome. Nucleic Acids Res. 32:D277–D280.
- ↵M. Kanehisa,S. Goto,M. Hattori,K.F. Aoki-Kinoshita,M. Itoh,S. Kawashima,T. Katayama,M. Araki,M. Hirakawa,(2006) From genomics to chemical genomics: New developments in KEGG. Nucleic Acids Res. 34:D354–D357.
- ↵J.Y. Kim,K. Tillison,J.-H. Lee,D.A. Rearick,C.M. Smas,(2006) The adipose tissue triglyceride lipase ATGL/PNPLA2 is downregulated by insulin and TNF-α in 3T3-L1 adipocytes and is a target for transactivation by PPARγ. Am. J. Physiol. Endocrinol. Metab. 291:E115–E127.
- ↵M. Kono,Y. Mi,Y. Liu,T. Sasaki,M.L. Allende,Y.-P. Wu,T. Yamashita,R.L. Proia,(2004) The sphingosine-1-phosphate receptors S1P1, S1P2, and S1P3 function coordinately during embryonic angiogenesis. J. Biol. Chem. 279:29367–29373.
- ↵M.M. Kulkarni,M. Booker,S.J. Silver,A. Friedman,P. Hong,N. Perrimon,B. Mathey-Prevot,(2006) Evidence of off-target effects associated with long dsRNAs in Drosophila melanogaster cell-based assays. Nat. Methods 3:833–838.
- ↵A.C. Lake,Y. Sun,J.-L. Li,J.E. Kim,J.W. Johnson,D. Li,T. Revett,H.H. Shih,W. Liu,J.E. Paulsen,(2005) Expression, regulation, and triglyceride hydrolase activity of Adiponutrin family members. J. Lipid Res. 46:2477–2487.
- ↵M. Liu,A. Liberzon,S.W. Kong,W.R. Lai,P.J. Park,I.S. Kohane,S. Kasif,(2007) Network-based analysis of affected biological processes in type 2 diabetes models. PLoS Genet. 3:e96, 10.1371/journal.pgen.0030096.
- ↵J. Lu,M.-L. Ruhf,N. Perrimon,P. Leder,(2007) A genome-wide RNA interference screen identifies putative chromatin regulators essential for E2F repression. Proc. Natl. Acad. Sci. 104:9381–9386.
- ↵Y. Ma,A. Creanga,L. Lum,P.A. Beachy,(2006) Prevalence of off-target effects in Drosophila RNA interference screens. Nature 443:359–363.
- ↵A.J. MacLennan,P.R. Carney,W.J. Zhu,A.H. Chaves,J. Garcia,J.R. Grimes,K.J. Anderson,S.N. Roper,N. Lee,(2001) An essential role for the H218/AGR16/Edg-5/LPB2 sphingosine 1-phosphate receptor in neuronal excitability. Eur. J. Neurosci. 14:203–209.
- ↵M. Martin,J.F. Reidhaar-Olson,C.M. Rondinone,(2007) Genetic association meets RNA interference: Large-scale genomic screens for causation and mechanism of complex diseases. Pharmacogenomics 8:455–464.
- ↵S. Mathivanan,B. Periaswamy,T.K.B. Gandhi,K. Kandasamy,S. Suresh,R. Mohmood,Y.L. Ramachandra,A. Pandey,(2006) An evaluation of human protein-protein interaction data in the public domain. BMC Bioinformatics 7:S19, 10.1186/1471-2105-7-S5-S19.
- ↵M. Mehrabian,H. Allayee,J. Stockton,P.Y. Lum,T.A. Drake,L.W. Castellani,M. Suh,C. Armour,S. Edwards,J. Lamb,(2005) Integrating genotypic and expression data in a segregating mouse population to identify 5-lipoxygenase as a susceptibility gene for obesity and bone traits. Nat. Genet. 37:1224–1233.
- ↵C.C. Mello,D. Conte,(2004) Revealing the world of RNA interference. Nature 431:338–342.
- ↵J. Moffat,D.M. Sabatini,(2006) Building mammalian signalling pathways with RNAi screens. Nat. Rev. Mol. Cell Biol. 7:177–187.
- ↵E.A.A. Nollen,S.M. Garcia,G. van Haaften,S. Kim,A. Chavez,R.I. Morimoto,R.H.A. Plasterk,(2004) From the cover: Genome-wide RNA interference screen identifies previously undescribed regulators of polyglutamine aggregation. Proc. Natl. Acad. Sci. 101:6403–6408.
- ↵J.V. Olsen,B. Blagoev,F. Gnad,B. Macek,C. Kumar,P. Mortensen,M. Mann,(2006) Global, in vivo, and site-specific phosphorylation dynamics in signaling networks. Cell 127:635–648.
- ↵O. Ourfali,T. Shlomi,T. Ideker,E. Ruppin,R. Sharan,(2007) SPINE: A framework for signaling-regulatory pathway inference from cause-effect experiments. Bioinformatics 23:i359–i366.
- ↵L. Pascoe,A. Tura,S.K. Patel,I.M. Ibrahim,E. Ferrannini,E. Zeggini,M.N. Weedon,A. Mari,A.T. Hattersley,M.I. McCarthy,(2007) Common variants of the novel type 2 diabetes genes CDKAL1 and HHEX/IDE are associated with decreased pancreatic β-cell function. Diabetes 56:3101–3104.
- ↵J.E. Pessin,A.R. Saltiel,(2000) Signaling pathways in insulin action: Molecular targets of insulin resistance. J. Clin. Invest. 106:165–169.
- ↵O. Sahin,C. Lobke,U. Korf,H. Appelhans,H. Sultmann,A. Poustka,S. Wiemann,D. Arlt,(2007) Combinatorial RNAi for quantitative protein network analysis. Proc. Natl. Acad. Sci. 104:6579–6584.
- ↵E.E. Schadt,S.A. Monks,T.A. Drake,A.J. Lusis,N. Che,V. Colinayo,T.G. Ruff,S.B. Milligan,J.R. Lamb,G. Cavet,(2003) Genetics of gene expression surveyed in maize, mouse and man. Nature 422:297–302.
- ↵E.E. Schadt,J. Lamb,X. Yang,J. Zhu,S. Edwards,D. GuhaThakurta,S.K. Sieberts,S. Monks,M. Reitman,C. Zhang,(2005) An integrative genomics approach to infer causal associations between gene expression and disease. Nat. Genet. 37:710–717.
- ↵V. Schoenborn,I.M. Heid,C. Vollmert,A. Lingenhel,T.D. Adams,P.N. Hopkins,T. Illig,R. Zimmermann,R. Zechner,S.C. Hunt,(2006) The ATGL gene is associated with free fatty acids, triglycerides, and type 2 diabetes. Diabetes 55:1270–1275.
- ↵L.J. Scott,K.L. Mohlke,L.L. Bonnycastle,C.J. Willer,Y. Li,W.L. Duren,M.R. Erdos,H.M. Stringham,P.S. Chines,A.U. Jackson,(2007) A genome-wide association study of type 2 diabetes in Finns detects multiple susceptibility variants. Science 316:1341–1345.
- ↵G. Solinas,C. Vilcu,J.G. Neels,G.K. Bandyopadhyay,J.-L. Luo,W. Naugler,S. Grivennikov,A. Wynshaw-Boris,M. Scadeng,J.M. Olefsky,(2007) JNK1 in hematopoietically derived cells contributes to diet-induced inflammation and insulin resistance without affecting obesity. Cell Metab. 6:386–397.
- ↵A. Subramanian,P. Tamayo,V.K. Mootha,S. Mukherjee,B.L. Ebert,M.A. Gillette,A. Paulovich,S.L. Pomeroy,T.R. Golub,E.S. Lander,(2005) From the cover: Gene set enrichment analysis: A knowledge-based approach for interpreting genome-wide expression profiles. Proc. Natl. Acad. Sci. 102:15545–15550.
- ↵H. Tamemoto,T. Kadowaki,K. Tobe,T. Yagi,H. Sakura,T. Hayakawa,Y. Terauchi,K. Ueki,Y. Kaburagi,S. Satoh,(1994) Insulin resistance and growth retardation in mice lacking insulin receptor substrate-1. Nature 372:182–186.
- ↵C.M. Taniguchi,B. Emanuelli,C.R. Kahn,(2006) Critical nodes in signalling pathways: Insights into insulin action. Nat. Rev. Mol. Cell Biol. 7:85–96.
- ↵G.M. Thompson,D. Trainor,C. Biswas,C. LaCerte,J.P. Berger,L.J. Kelly,(2004) A high-capacity assay for PPARγ ligand regulation of endogenous aP2 expression in 3T3-L1 cells. Anal. Biochem. 330:21–28.
- ↵R.C. Turner,R.R. Holman,D. Matthews,T.D.R. Hockaday,J. Peto,(1979) Insulin deficiency and insulin resistance interaction in diabetes: Estimation of their relative contribution by feedback analysis from basal plasma insulin and glucose concentrations. Metabolism 28:1086–1096.
- ↵J. Villen,S.A. Beausoleil,S.A. Gerber,S.P. Gygi,(2007) Large-scale phosphorylation analysis of mouse liver. Proc. Natl. Acad. Sci. 104:1488–1493.
- ↵C.-H. Yeang,T. Ideker,T. Jaakkola,(2004) Physical network models. J. Comput. Biol. 11:243–262.
- ↵H. Yki-Jarvinen,M.R. Taskinen,(1988) Interrelationships among insulin's antilipolytic and glucoregulatory effects and plasma triglycerides in nondiabetic and diabetic patients with endogenous hypertriglyceridemia. Diabetes 37:1271–1278.
- ↵R. Zechner,J.G. Strauss,G. Haemmerle,A. Lass,R. Zimmermann,(2005) Lipolysis: Pathway under construction. Curr. Opin. Lipidol. 16:333–340.
- ↵J. Zhu,B. Zhang,E.N. Smith,B. Drees,R.B. Brem,L. Kruglyak,R.E. Bumgarner,E.E. Schadt,(2008) Integrating large-scale functional genomic data to dissect the complexity of yeast regulatory networks. Nat. Genet. 40:854–861.
Notes
[6] [Supplemental material is available online at www.genome.org.]
[7] Article published online before print. Article and publication date are at http://www.genome.org/cgi/doi/10.1101/gr.087890.108.