
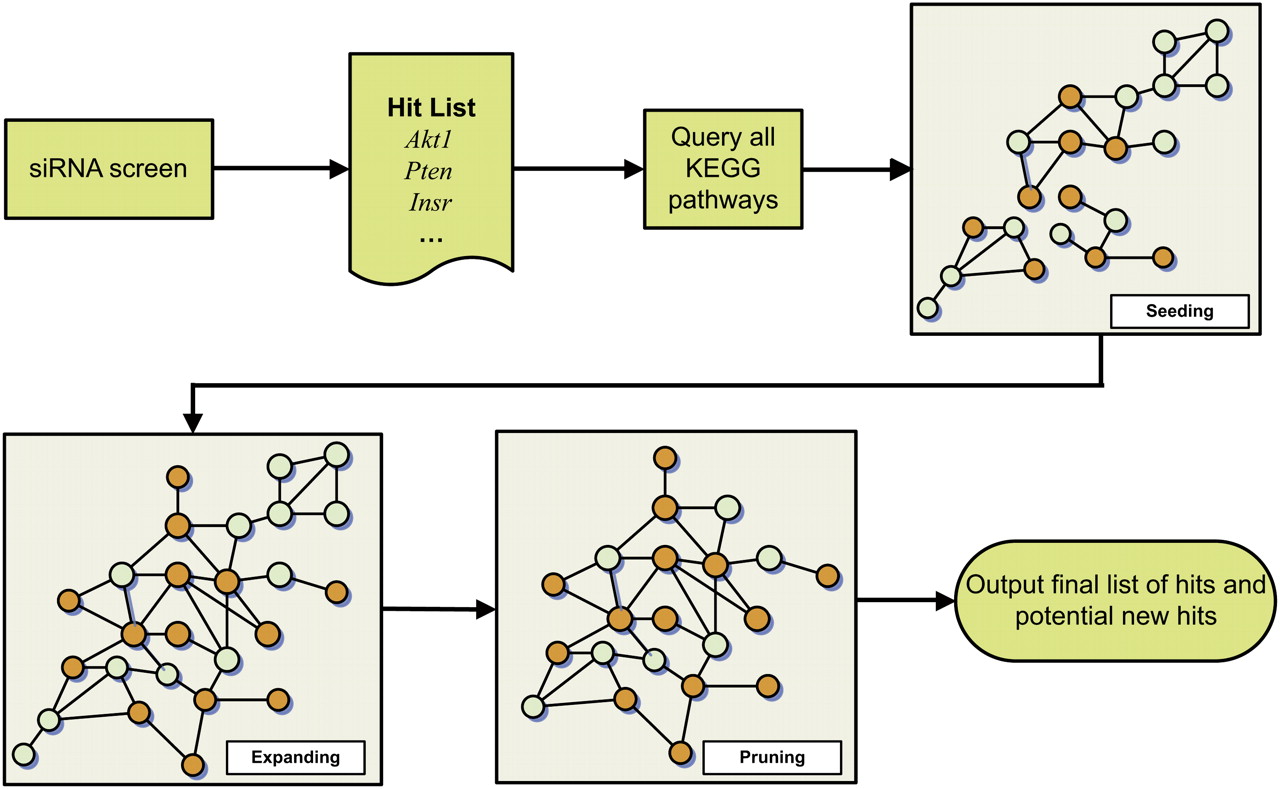
Flow diagram for the PEXA network reconstruction process. This reconstruction process consists of four steps: (1) perturbing genes of interest using siRNA to identify those that produce the desired phenotype (referred to here as the hit list); (2) querying through all the pathways in the KEGG database with the hit list to identify seeding paths; (3) expanding the seeding paths using PPI data to obtain a more coherent network relating to the biological process of interest (insulin signaling in this case); and (4) pruning the network obtained in step 3 to enhance the biological coherence of the network with respect to the biological processes of interest. In the hypothetical networks depicted in this figure, the orange nodes correspond to genes in the siRNA hit list, while the blue nodes are supported by the KEGG and/or PPI data as operating in the same part of the network as the hit list genes.


