
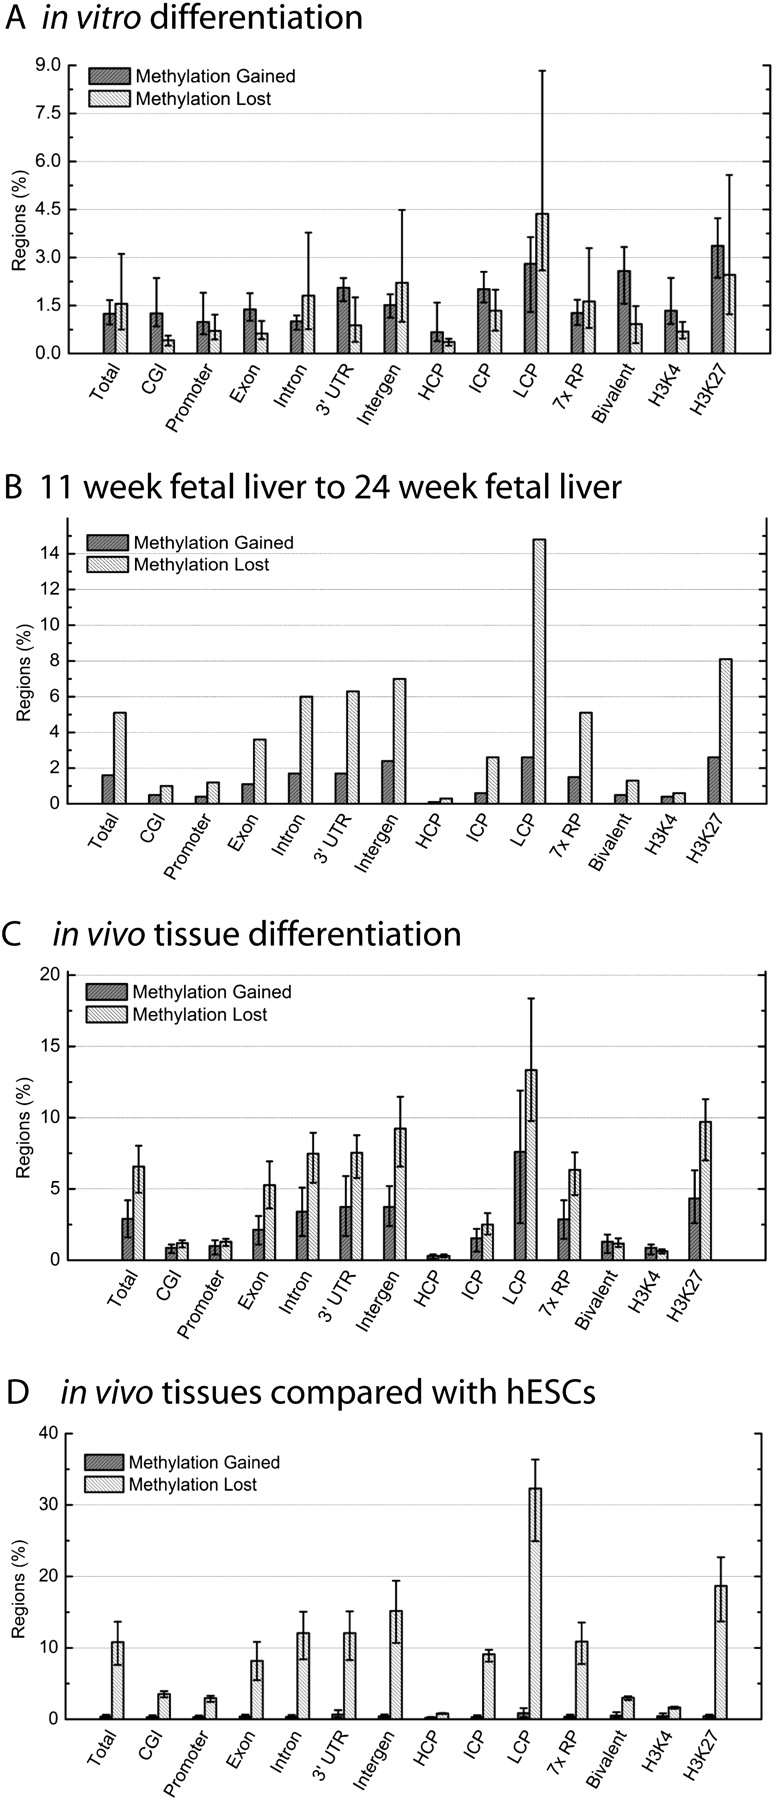
Percent of regions showing methylation changes by genomic feature. (A) Mean percentage of regions that gain or lose methylation in in vitro-differentiated cells compared with hESCs (y-axis), grouped by genomic features (x-axis). Categories are total changes, changes in CpG islands (CGI), promoters and 5′ UTRs (promoter), exons, introns, 3′ UTRs, intergenic regions (intergen), HCPs, ICPs, LCPs, 7× regulatory potential (7× RP), H3K4me3/H3K27me3-occupied regions (bivalent), H3K4me3-occupied regions (H3K4), and H3K27me3-occupied regions (H3K27). Error bars, maximum and minimum values across five differentiated sample comparisons: H9 hESC vs. H9 Endoderm (5→6), H9 hESC vs. H9 AFP+ hESC-derived cells (5→7), H9 hESC vs. H9 Embryoid bodies (5→9), H9 hESC vs. H9 EB-derived cells (5→11), BG02 hESC vs. BG02 EB-derived cells rep1 and rep2 (12→13,14). (B) Percentage of regions that gain or lose methylation in 11-wk fetal liver compared with 24-wk fetal liver (y-axis), grouped by genomic features (x-axis). Data are from the sample comparison between 11-wk fetal liver and 24-wk fetal liver (15→16). (C) Mean percentage of regions that gain or lose methylation during tissue differentiation (y-axis), grouped by genomic features (x-axis). Error bars, maximum and minimum values across three tissue sample comparisons: 11-wk fetal liver vs. 24-wk fetal liver (15→16), 11-wk fetal liver vs. adult liver (15→17), 24-wk fetal liver vs. adult liver (16→17). (D) Mean percentage of regions that gain or lose methylation in tissues compared with hESCs (y-axis), grouped by genomic features (x-axis). Error bars, maximum and minimum values across three tissue sample comparisons: H9 hESC and BG02 hESC vs. 11-wk fetal liver (5,12→15), H9 hESC and BG02 hESC vs. 24-wk fetal liver (5,12→16), H9 hESC and BG02 hESC vs. adult liver (5,12→17). Library numbers are in parentheses.


