
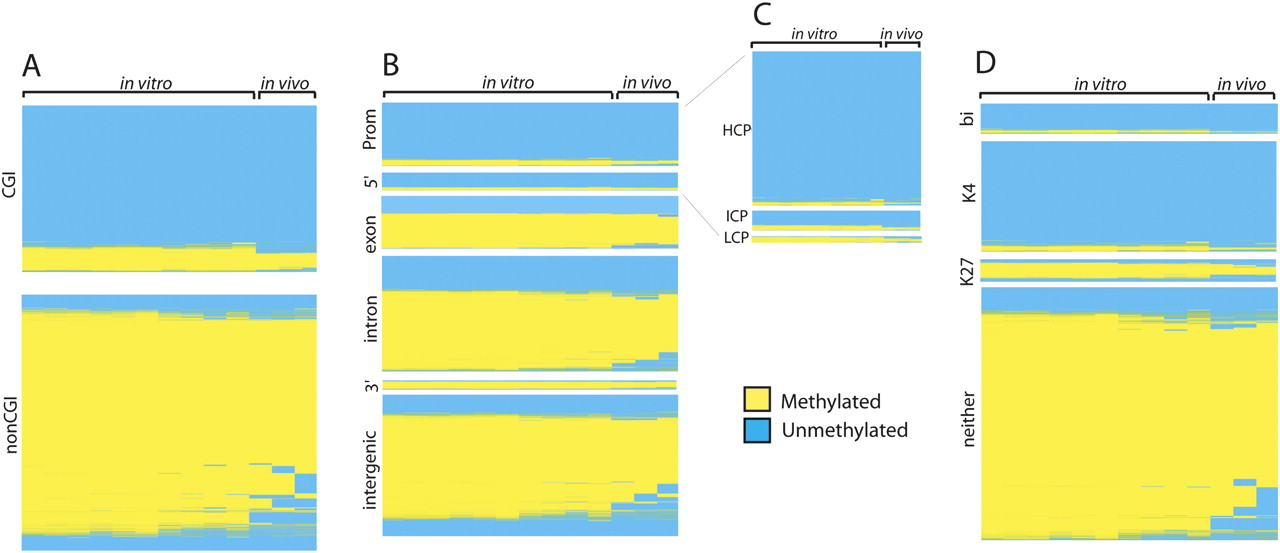
Hierarchal clustering of Methyl-seq regions for each of the tissues assayed. (A) Clustergram of Methyl-seq data reclustered by region for regions overlapping with annotated CpG islands (CGI) or regions outside of CpG islands (nonCGI). Samples are not reclustered from Figure 2D and are as follows. In vitro: H9 endoderm (6), H9 hESC (5), H9 conditioned medium (10), H9 AFP-positive hESC-derived cells (7), H9 AFP-negative hESC-derived cells (8), H9 embryoid bodies (9), BG02 hESC (12), BG02 EB-derived cells (13), BG02 EB-derived cells (14), H9 EB-derived cells (11); in vivo: fetal liver 11 wk (15), fetal liver 24 wk (16), adult liver (17). (B) Clustergram of Methyl-seq data reclustered by region overlap with gene structure annotations: promoters (Prom), 5′ UTRs (5′), coding exons (exon), introns (intron), 3′ UTRs (3′), and intergenic regions. Samples are again ordered as described in A. (C) Clustergram of Methyl-seq data reclustered by region overlap with promoter CpG density annotations: HCP, ICP, and LCP. Samples are ordered as described in A. (D) Clustergram of Methyl-seq data reclustered by region overlap with histone data: bivalent domains (bi), H3K4me3 (K4), H3K27me3 (K27), or regions bound by neither histone (neither). Samples are ordered as described in A.


