
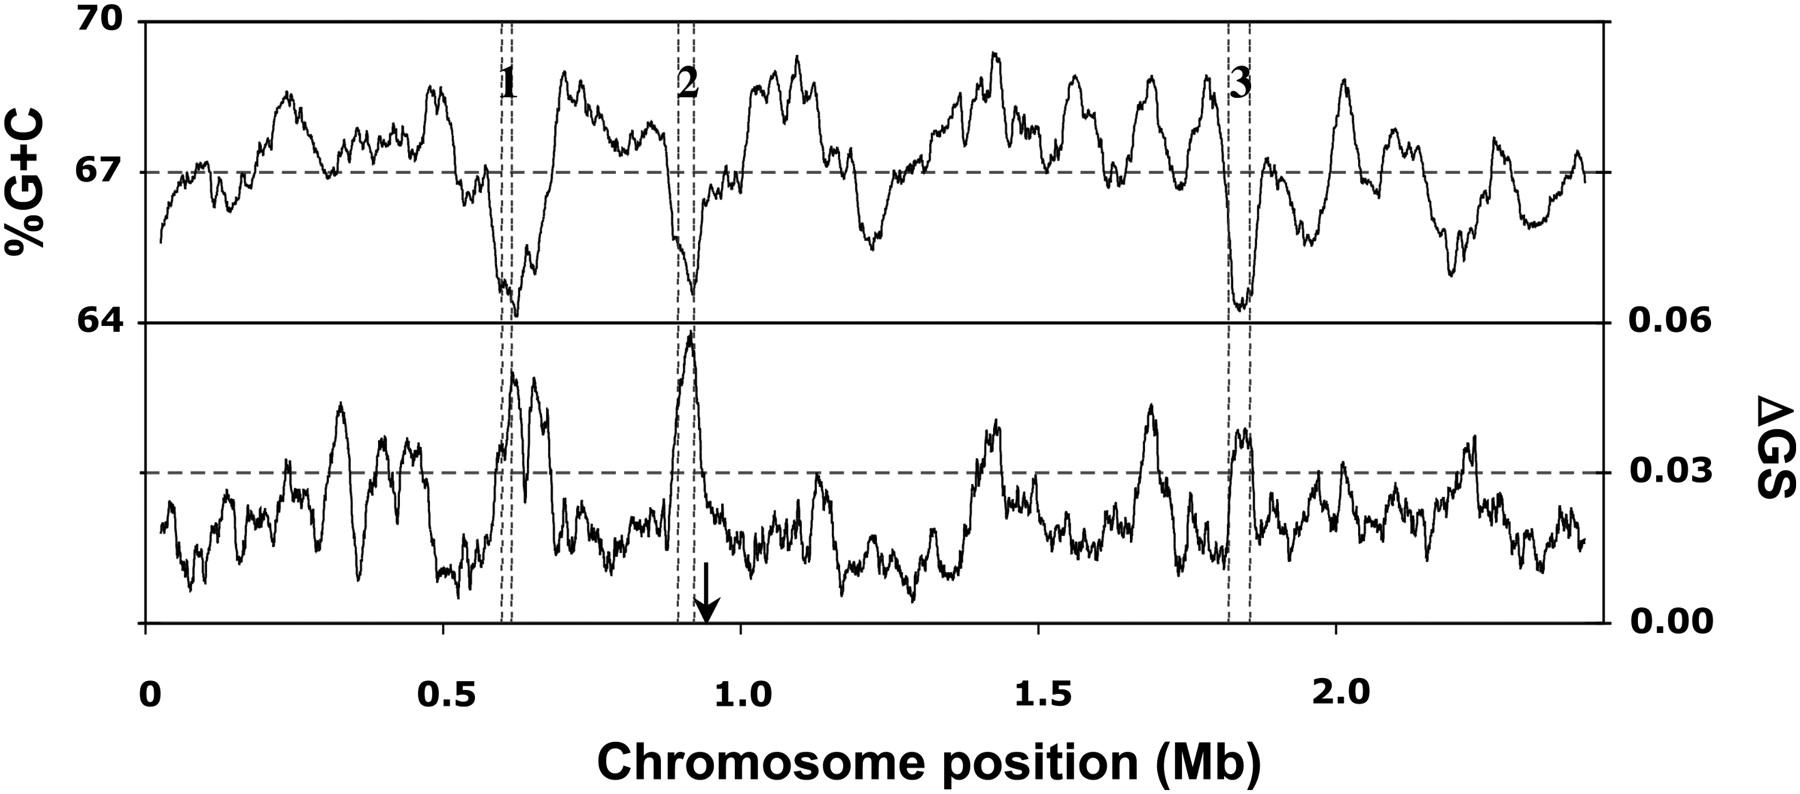
Figure 2.
Genomic signature plot. A sliding window plot of the percent G+C content (top line, y-axis on the left) as well as the deviation in genomic signature (ΔGS; bottom line, secondary y-axis on right) along the chromosome. Regions 1, 2, and 3 on the plot indicate the location of the three GIs: GI1, GI2, and GI3, respectively. Arrow indicates the location of the flagellar and motility genes.


