
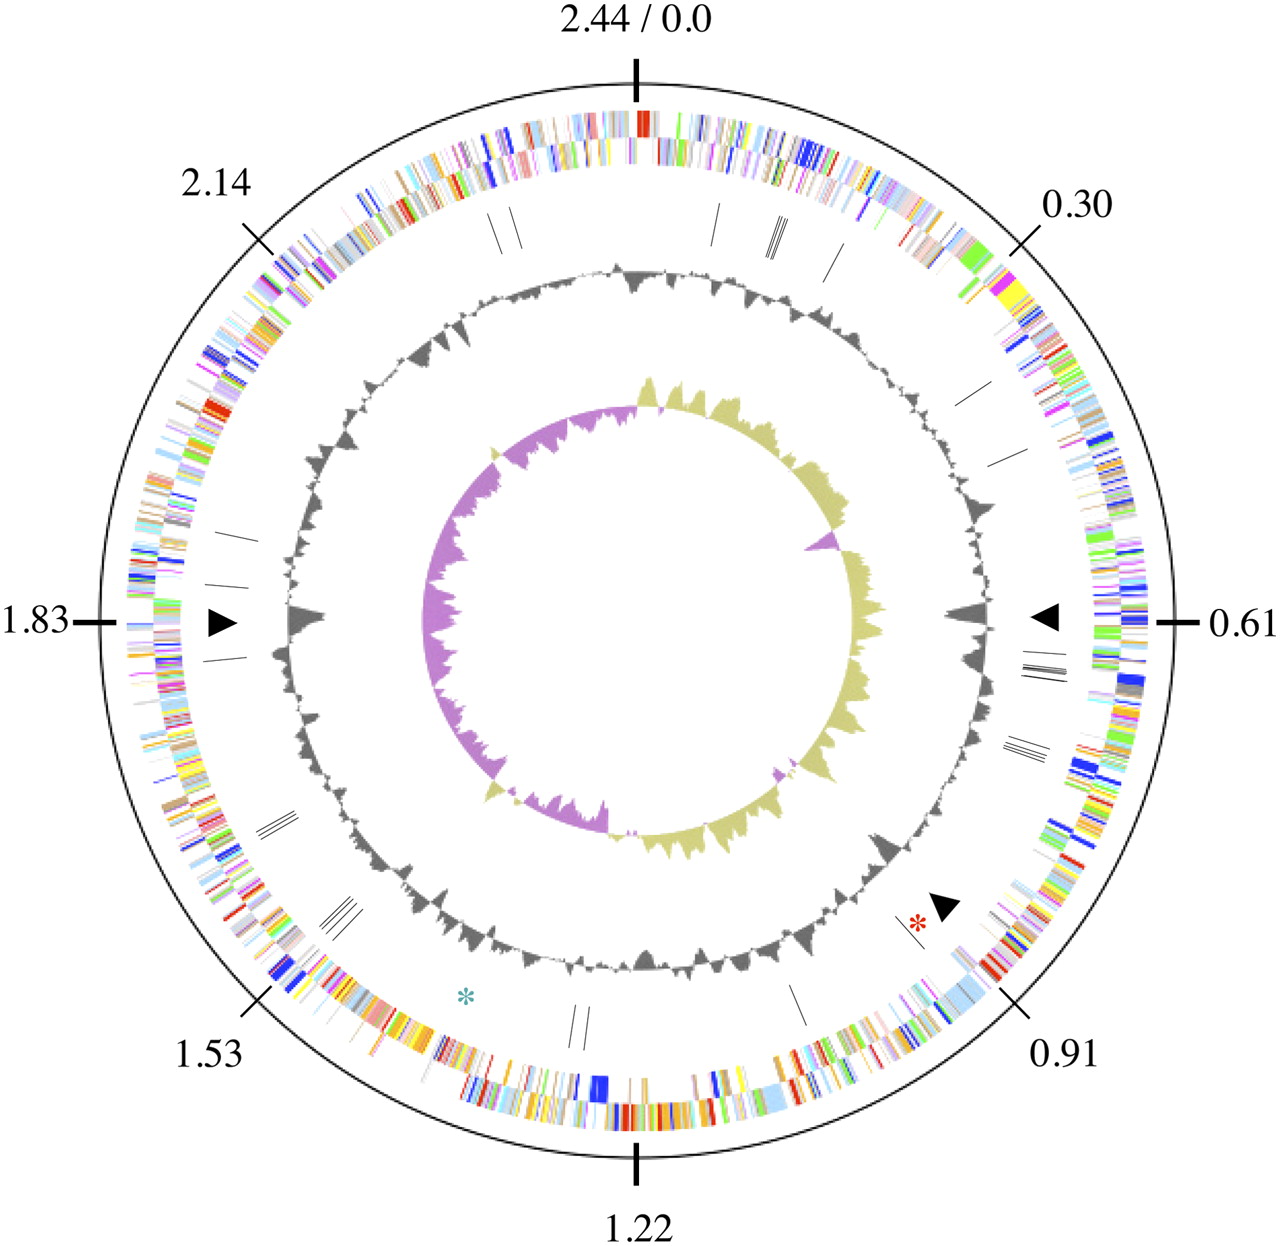
Schematic of the A. cellulolyticus 11B genome. The outermost circle gives the genome coordinates. The next two inner rings show the predicted genes on the leading (outer circle) and the lagging (inner circle) strands. Color scheme is as follows: dark gray, hypothetical proteins; light gray, conserved hypothetical and unknown function; brown, general function prediction; red, replication and repair; green, energy metabolism; blue, carbon and carbohydrate metabolism; cyan, lipid metabolism; magenta, transcription; yellow, translation; orange, amino acid metabolism; pink, metabolism of cofactors and vitamins; light red, purine and pyrimidine metabolism; lavender, signal transduction; sky blue, cellular processes; pale green, structural RNAs. Ring 4 displays the positions of the glycoside hydrolases (black bars), the three GIs (triangles), the flagellar biosynthetic genes (red star) , and the rRNA operon (blue star). Ring 5 shows the G+C content along the genome. The innermost ring, ring 6, displays the GC skew.


