
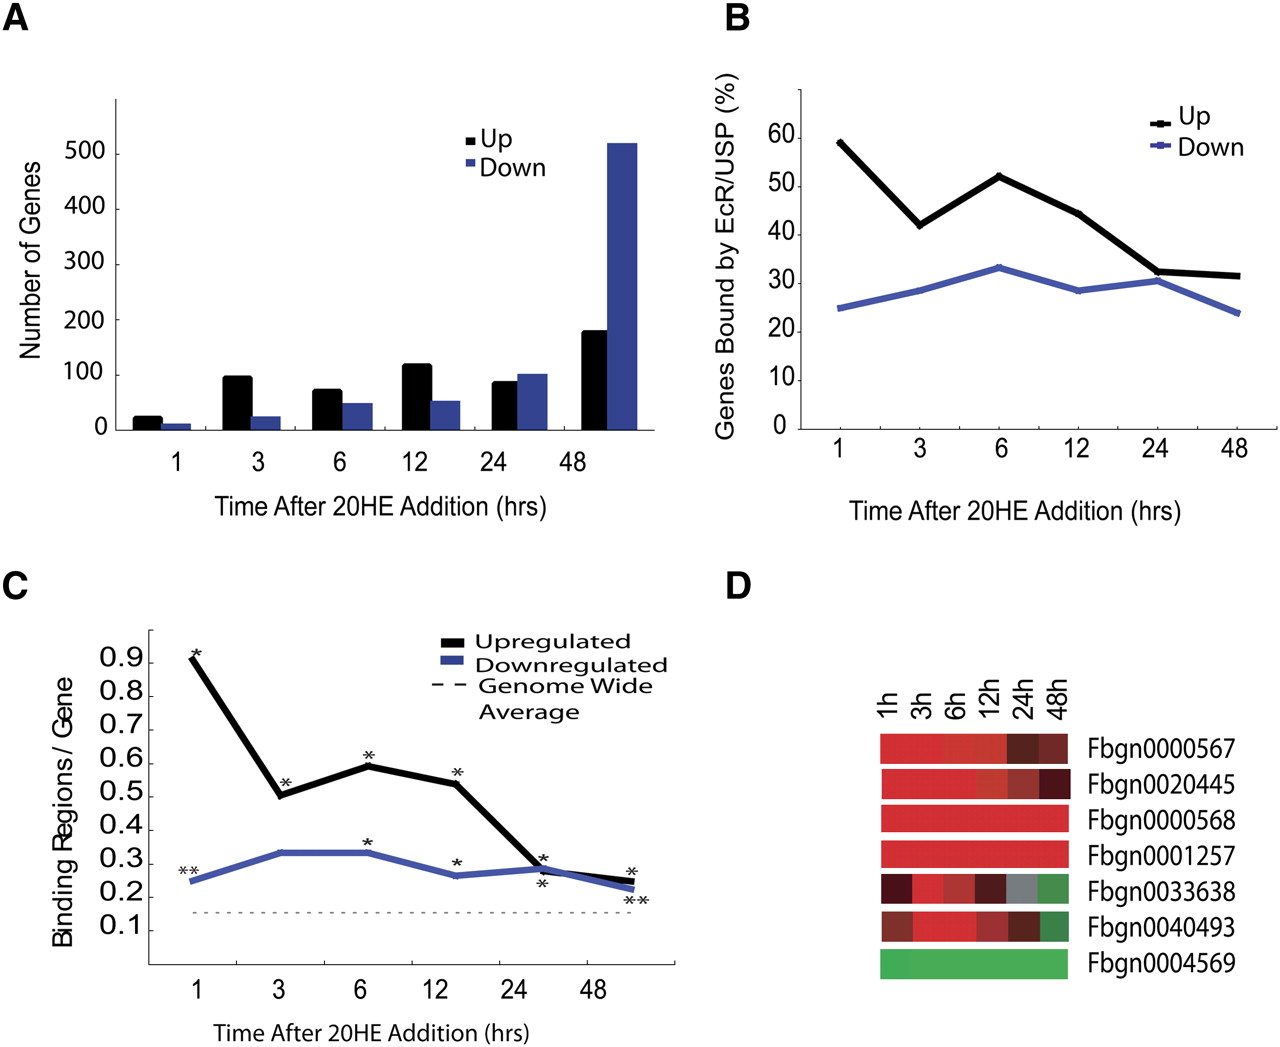
Binding profiles of 20-HE-responsive genes. (A) Total number of up-regulated or down-regulated genes 1–48 h after 20-HE addition. (B) The number of up-regulated direct targets decreases steadily with time; however, the number of down-regulated direct targets stays steady across the time course. (C) The number of binding regions per up-regulated 20-HE-responsive gene (br/g) decreases with time; however, the number of binding sites near down-regulated direct targets stays ∼0.24 throughout the time course. Dotted line is the average binding regions/gene (br/g) across the genome. P-values are shown ([*] <0.001, [**] <0.01) from a distribution of br/g generated from permutation tests of randomly sampled genes. (D) Expression profile of several early up-regulated (red) and down-regulated (green) direct targets of ECR/USP.


