
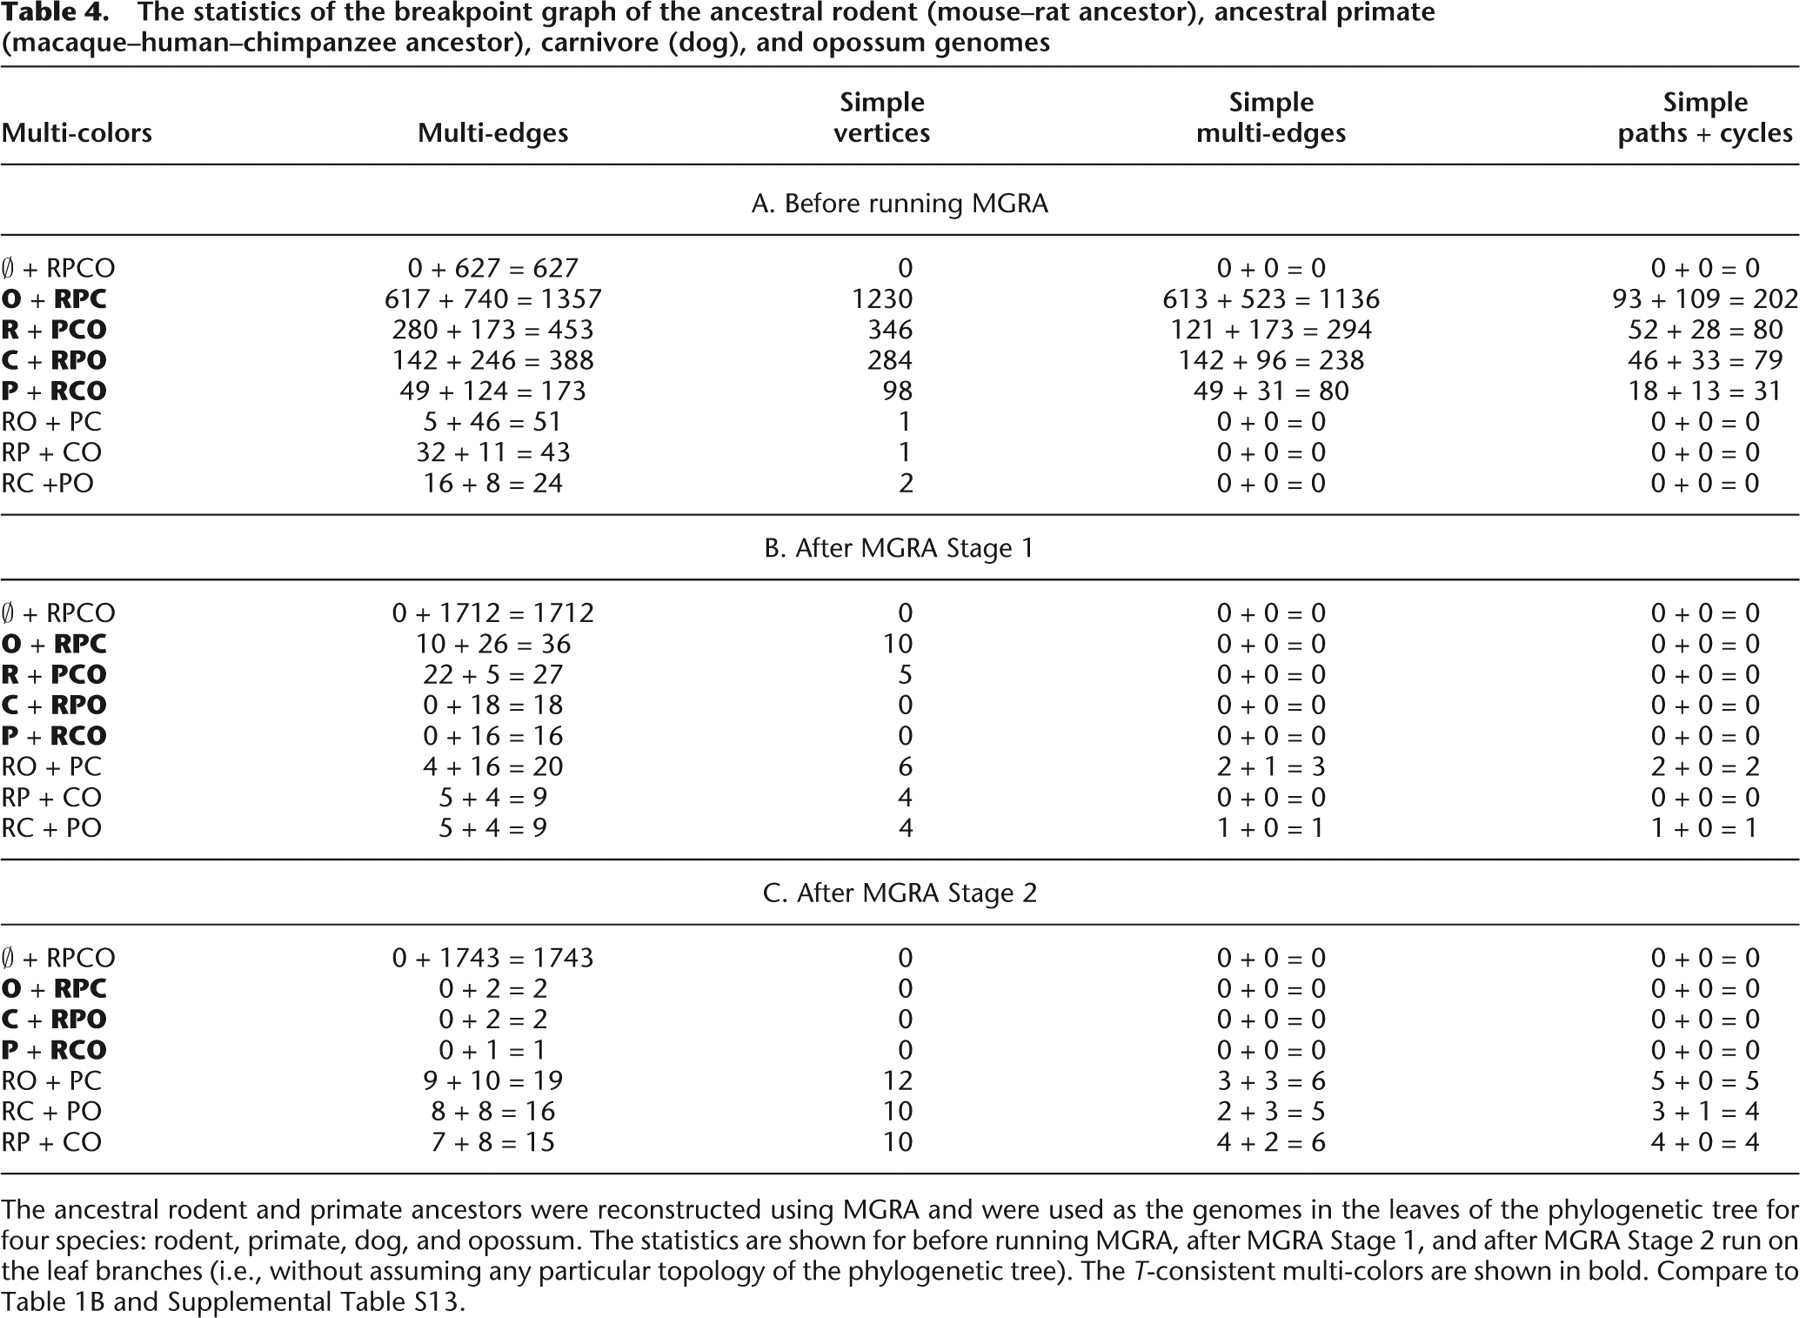
The statistics of the breakpoint graph of the ancestral rodent (mouse–rat ancestor), ancestral primate (macaque–human–chimpanzee ancestor), carnivore (dog), and opossum genomes
Click on table to view larger version.
-
The ancestral rodent and primate ancestors were reconstructed using MGRA and were used as the genomes in the leaves of the phylogenetic tree for four species: rodent, primate, dog, and opossum. The statistics are shown for before running MGRA, after MGRA Stage 1, and after MGRA Stage 2 run on the leaf branches (i.e., without assuming any particular topology of the phylogenetic tree). The T-consistent multi-colors are shown in bold. Compare to Table 1B and Supplemental Table S13.


