
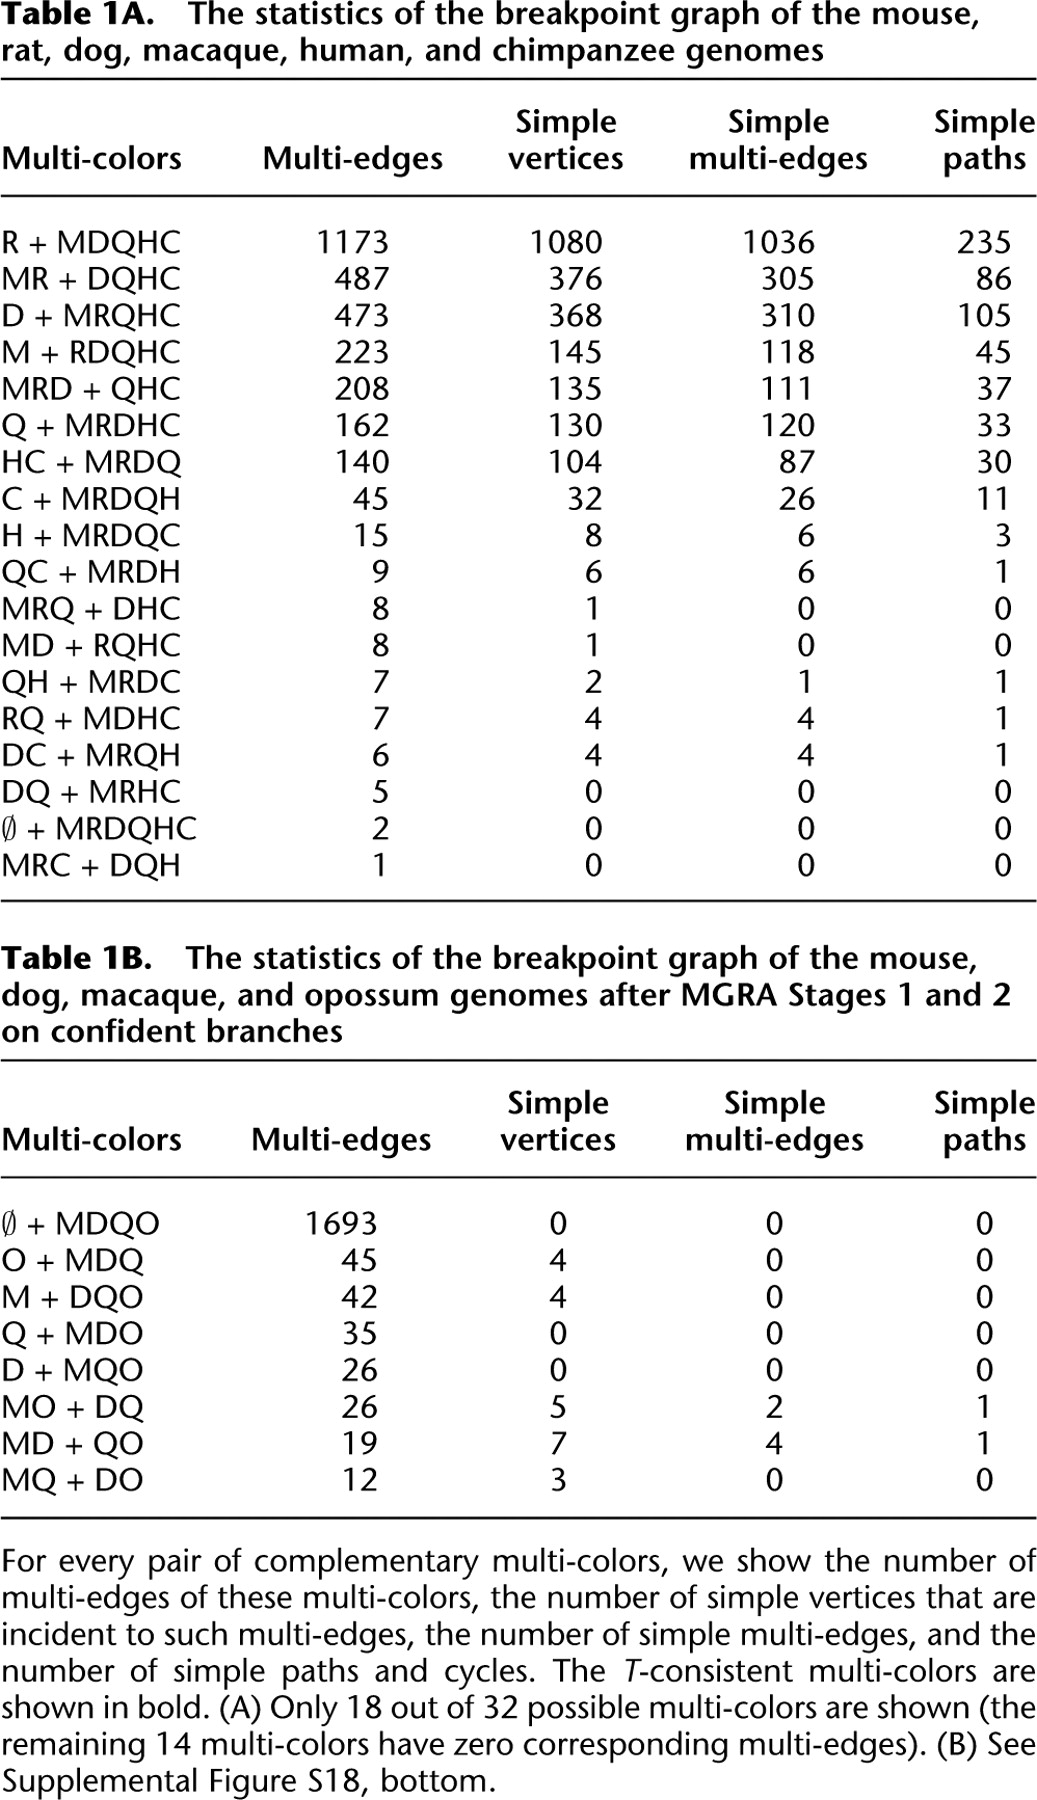
Table 1A.
The statistics of the breakpoint graph of the mouse, rat, dog, macaque, human, and chimpanzee genomes
Click on table to view larger version.
-
For every pair of complementary multi-colors, we show the number of multi-edges of these multi-colors, the number of simple vertices that are incident to such multi-edges, the number of simple multi-edges, and the number of simple paths and cycles. The T-consistent multi-colors are shown in bold. (A) Only 18 out of 32 possible multi-colors are shown (the remaining 14 multi-colors have zero corresponding multi-edges). (B) See Supplemental Figure S18, bottom.


