
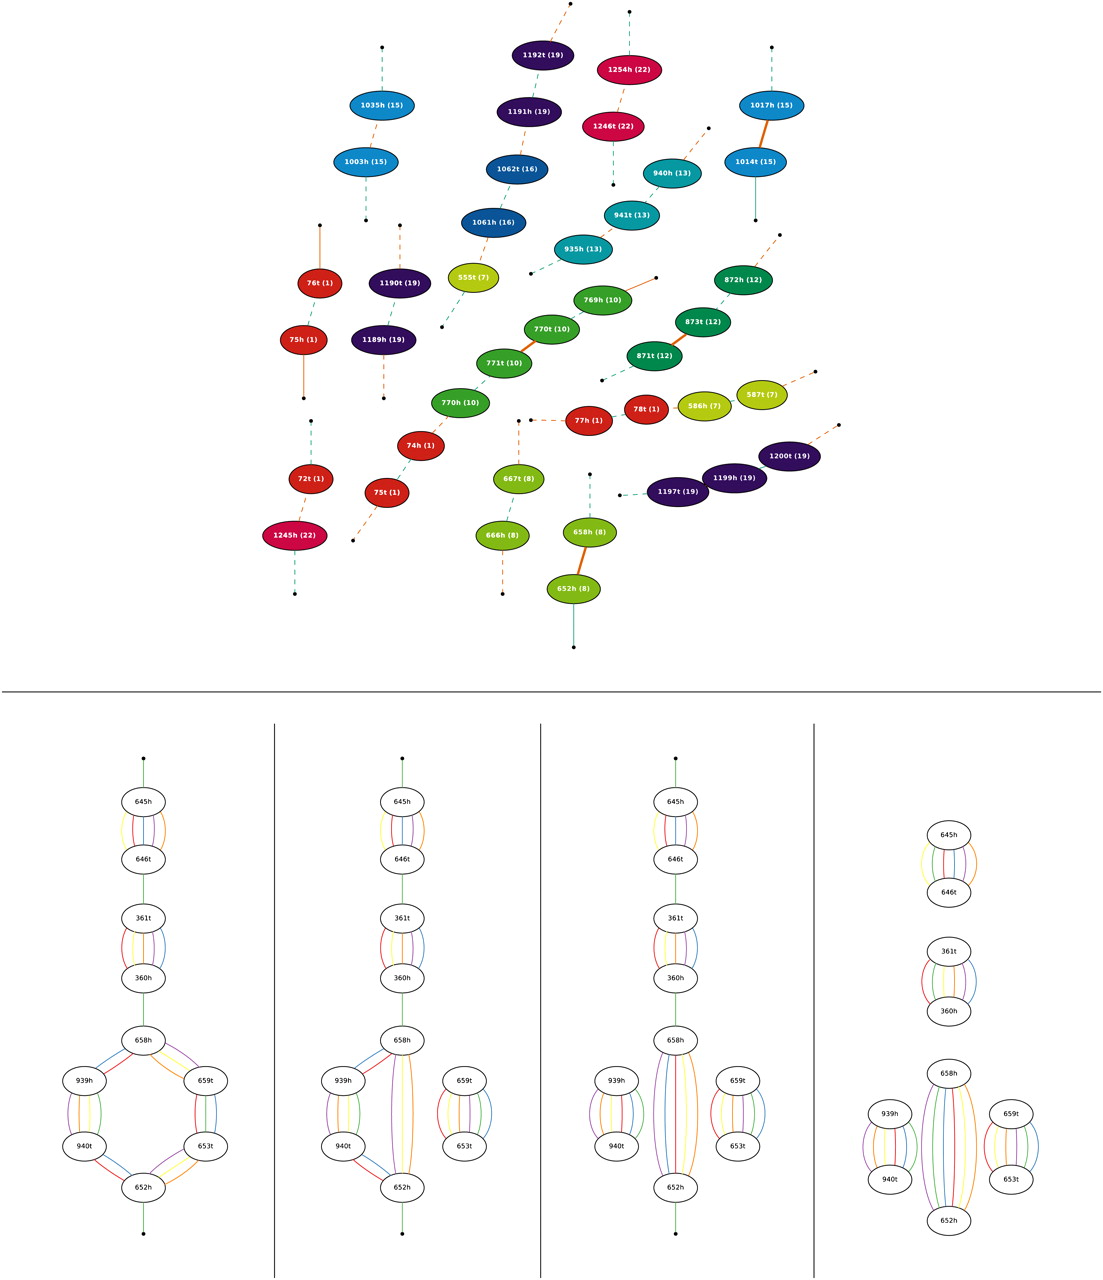
(Top panel) The breakpoint graph of the genomes MRDCARs (cyan) and MRD′CARs (orange) reconstructed by inferCARs (common adjacencies are not shown). (Bold edges) Reliable adjacencies (resolved by MGRA Stage 1); (dashed edges) “ambiguous joins” (see Ma et al. 2006) made by inferCARs. Vertex colors are coded as in Figure 4. (Bottom panel) A most parsimonious transformation of one connected component (containing vertices 658h and 652h) of the breakpoint graph G(M,R,D,Q,H,C) from Figure 4. (First panel from left) The initial component is transformed with (second panel) a 2-break in primates, (third panel) a 2-break in rodents, and (fourth panel) two 2-breaks in dog resulting from processing of a good D + MRQCH path.


