
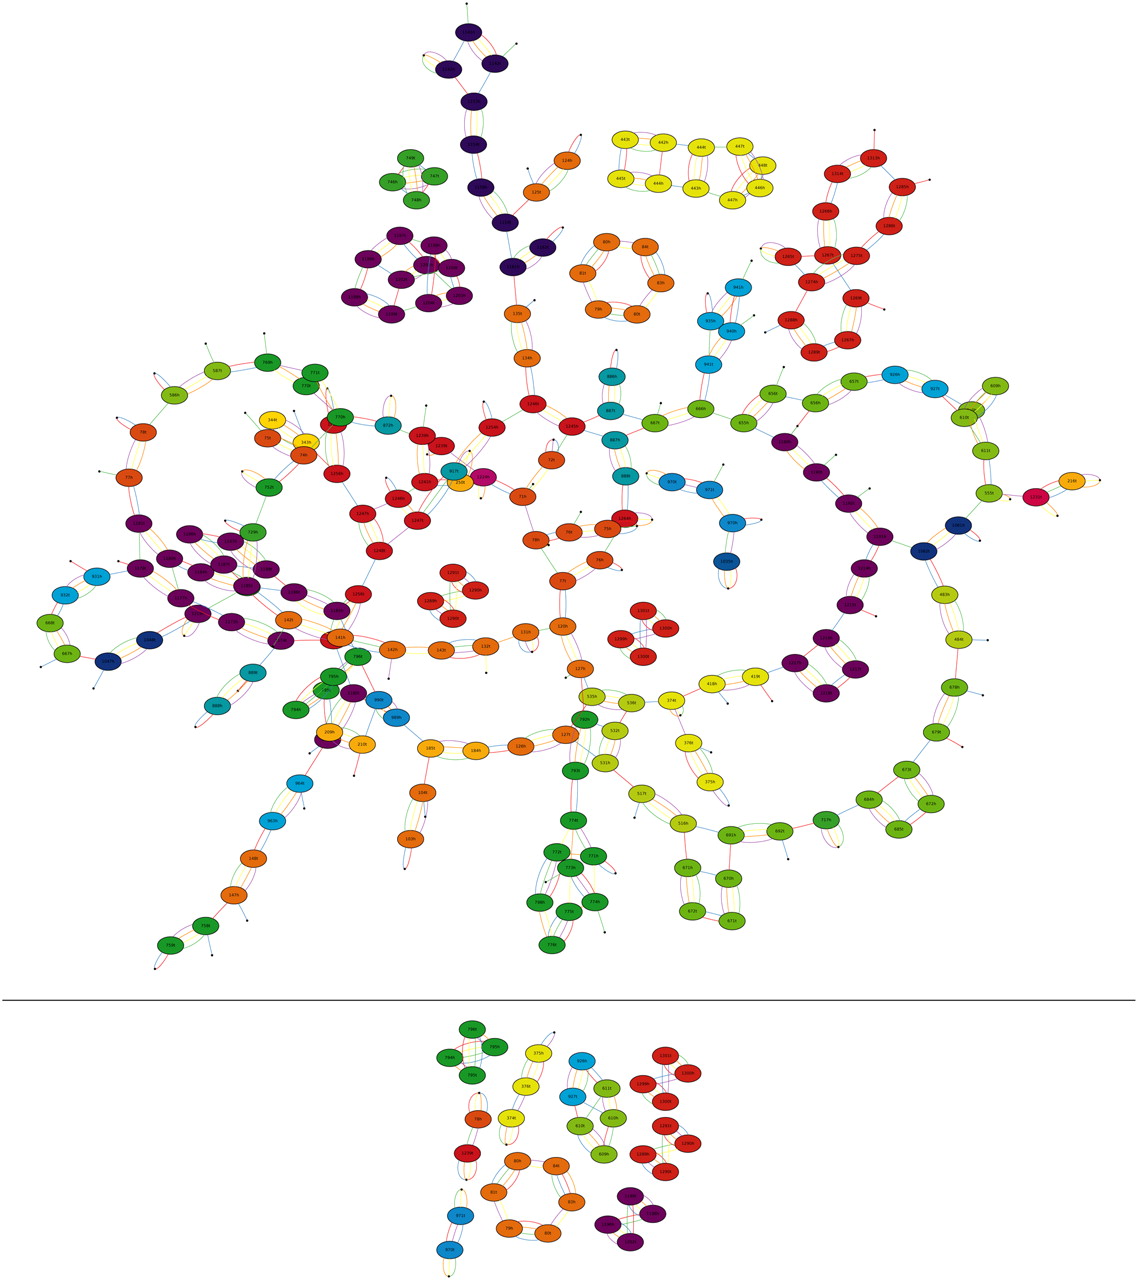
Figure 7.
The breakpoint graph G(M,R,D,Q,H,C) (the complete multi-edges are not shown) after MGRA Stage 1 (top panel) and after MGRA Stages 1–2 (bottom panel). The edge colors represent mouse (red), rat (blue), dog (green), macaque (violet), human (orange), and chimpanzee (yellow) genomes. Vertices are labeled and colored similarly to Figure 4.


