
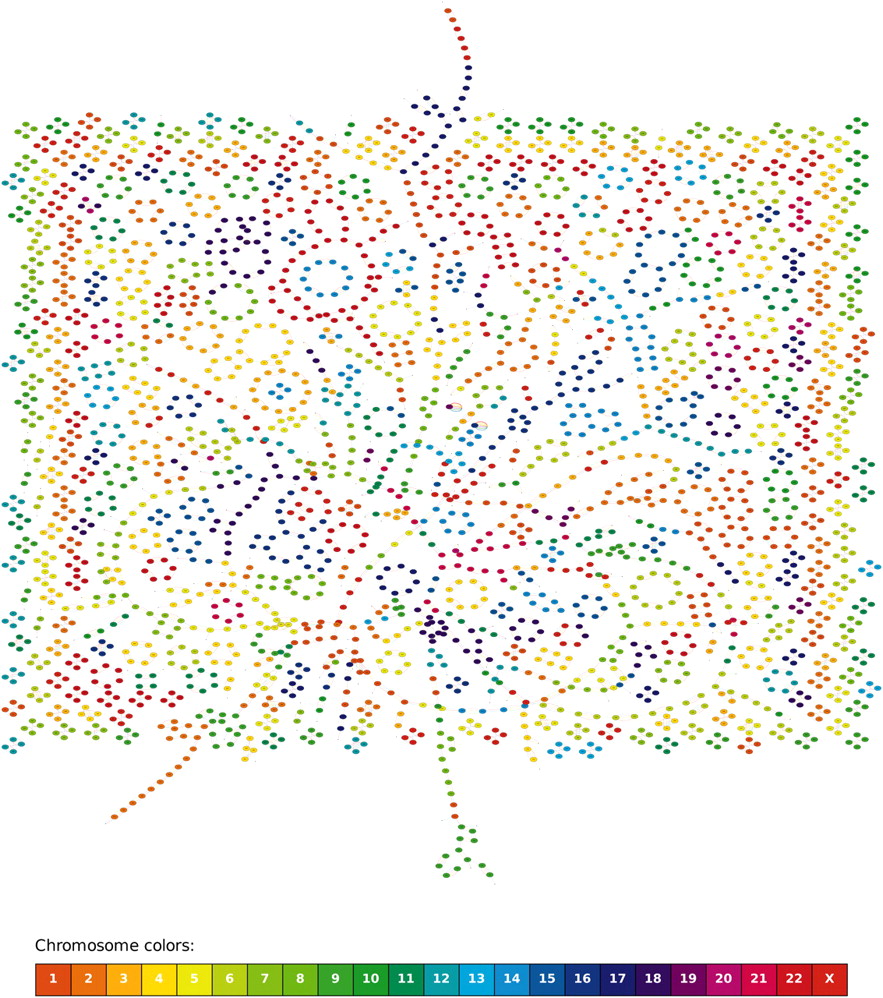
Figure 4.
The breakspoint graph G(M,R,D,Q,H,C) (obverse edges are not shown) of six mammalian genomes: mouse (red edges), rat (blue edges), dog (green edges), macaque (violet edges), human (orange edges), and chimpanzee (yellow edges). The graph has 1357 × 2 = 2714 vertices labeled as nt or nh (where n is a synteny block number) and colored in 23 colors representing chromosomes in the human genome.


