
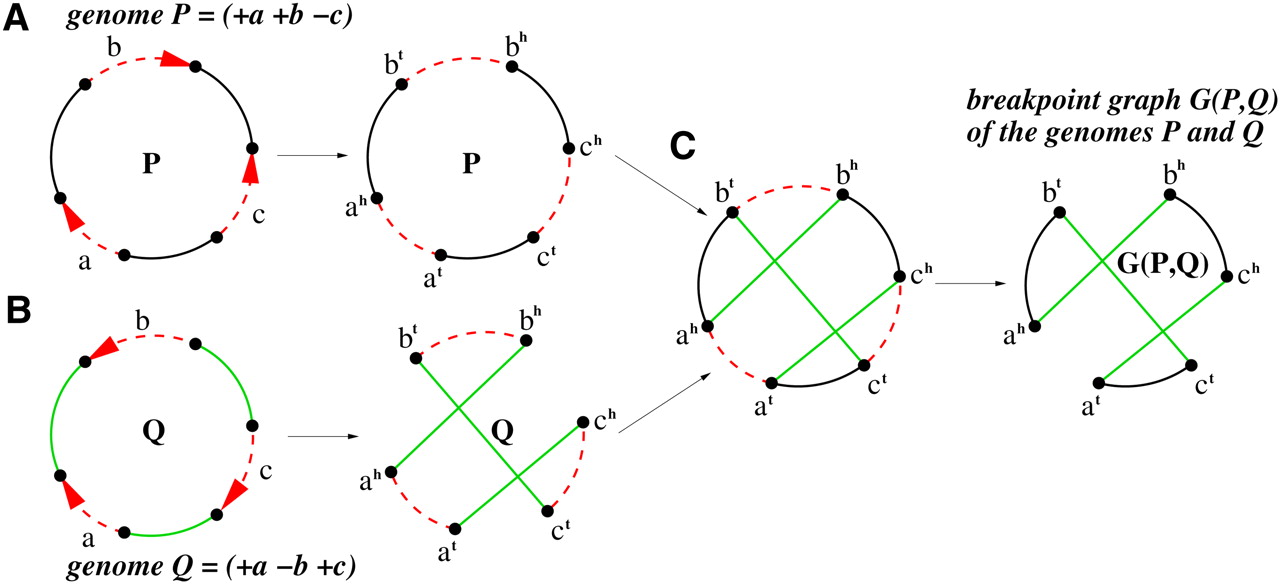
Figure 1.
(A) Unichromosomal genome P = (+a +b −c) represented as a black-obverse cycle. (B) Unichromosomal genome Q = (+a −b +c) represented as a green-obverse cycle. (C) The breakpoint graph G(P, Q) with and without obverse edges.


