
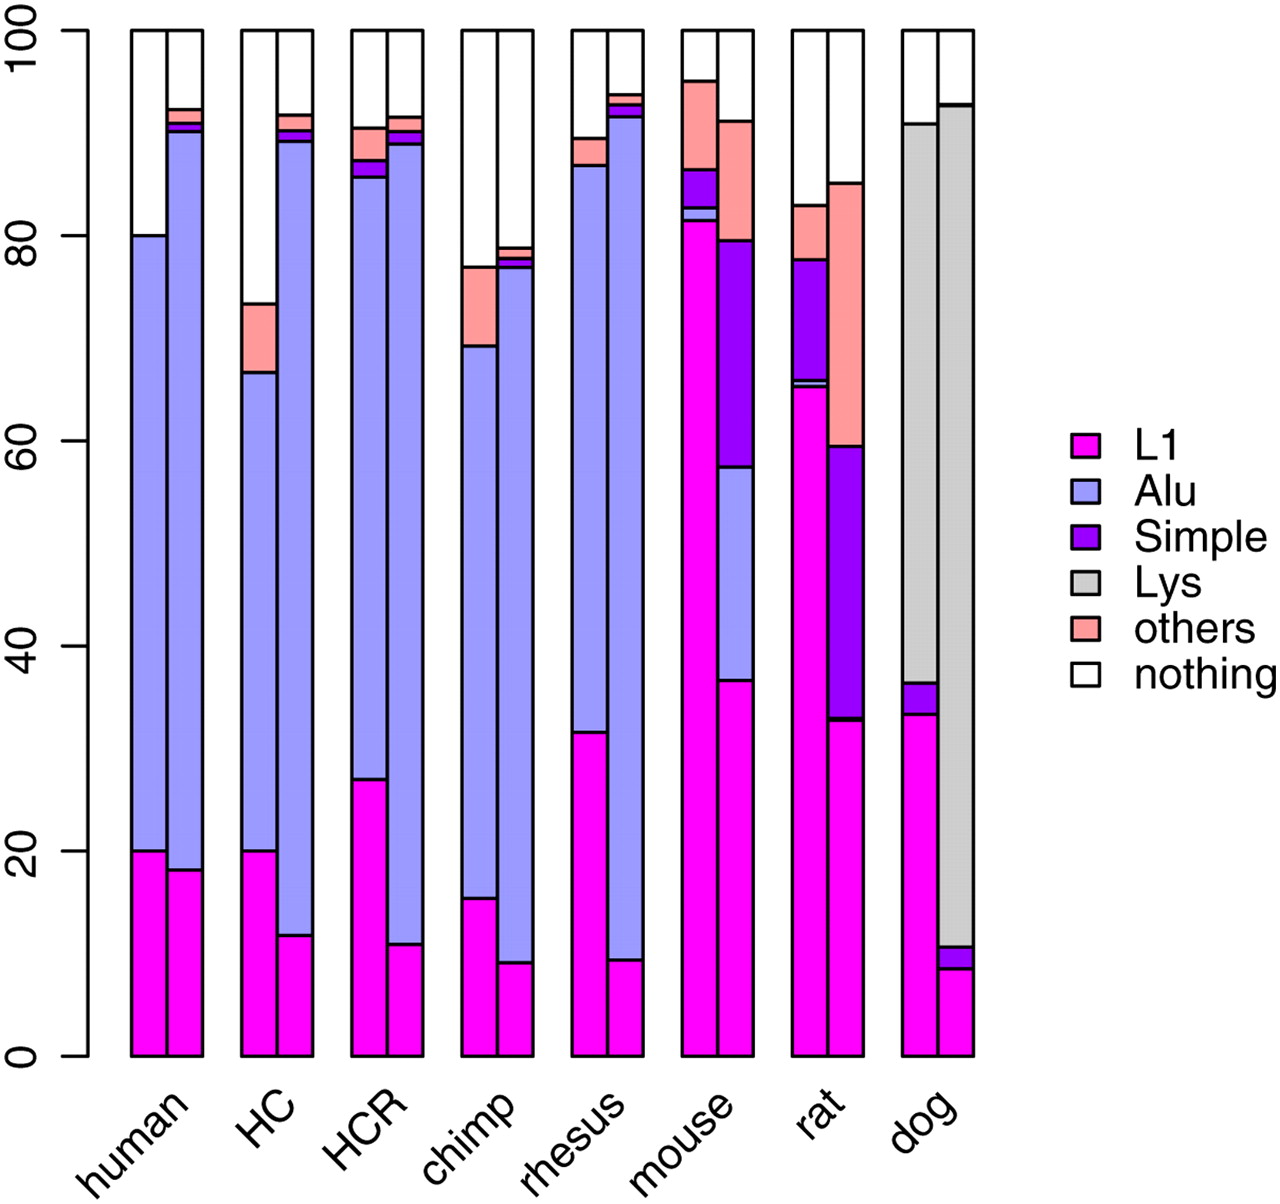
Figure 7.
Overrepresentation of alignable pairs of L1 repeats in the breakpoints of mammalian reversals. In each lineage, the first bar represents the proportion of reversals for which the best BLAST alignment overlaps a particular repeat family, and the second bar represents the proportion of reversals that is expected to overlap a particular repeat family based on size-matched random simulations. This analysis is restricted to the 550 reversals with breakpoints defined within 100 kb.


