
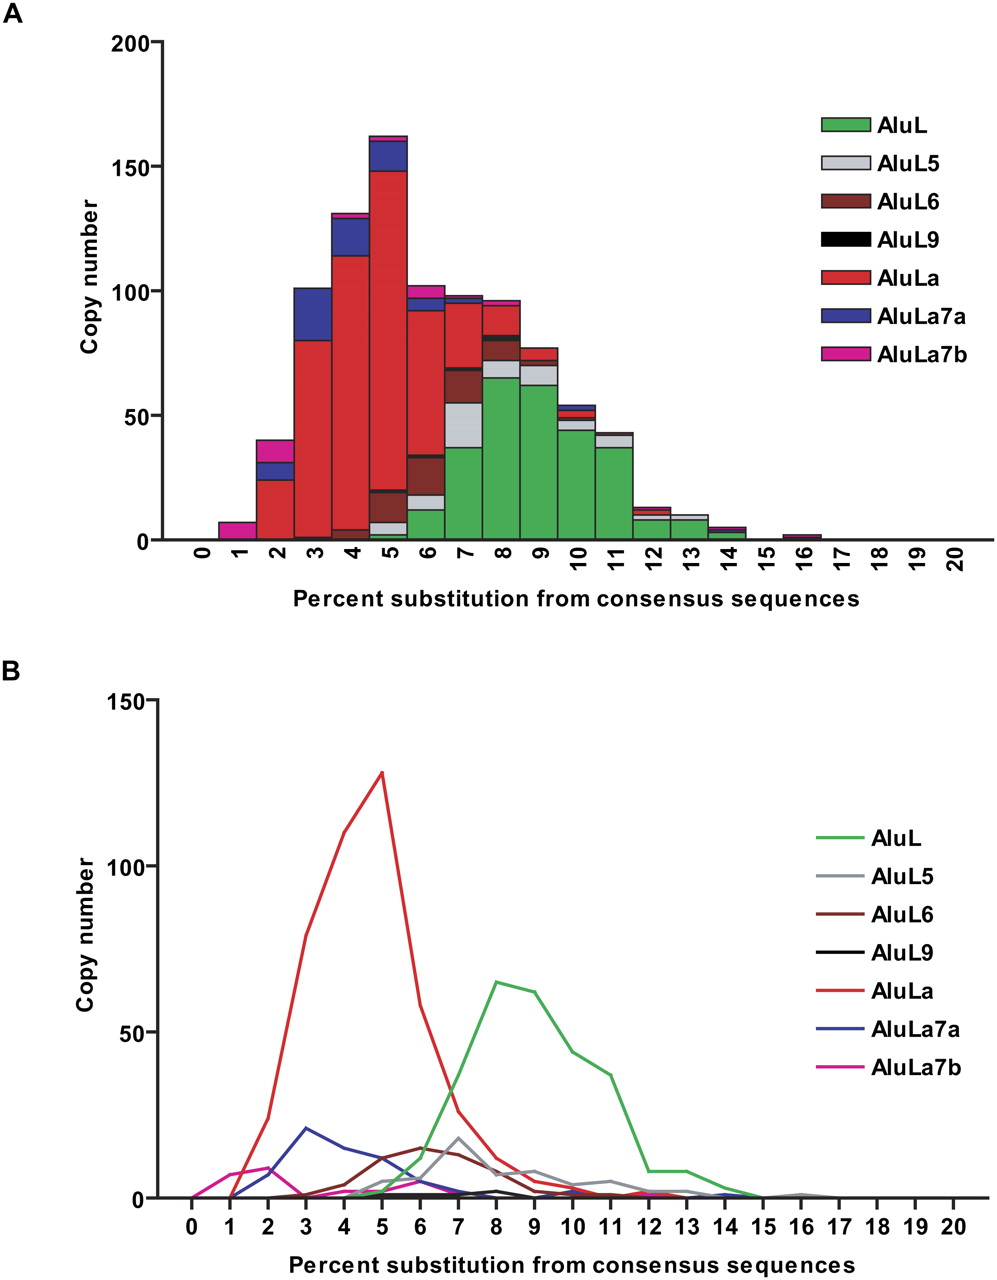
Figure 6.
Sequence divergence distribution of lemur-specific Alu subfamilies. The sequence divergence distributions are plotted in bins corresponding to 0.01 increments after correction for the CpG content by (A) summing all seven subfamilies or (B) separately for each subfamily.


