
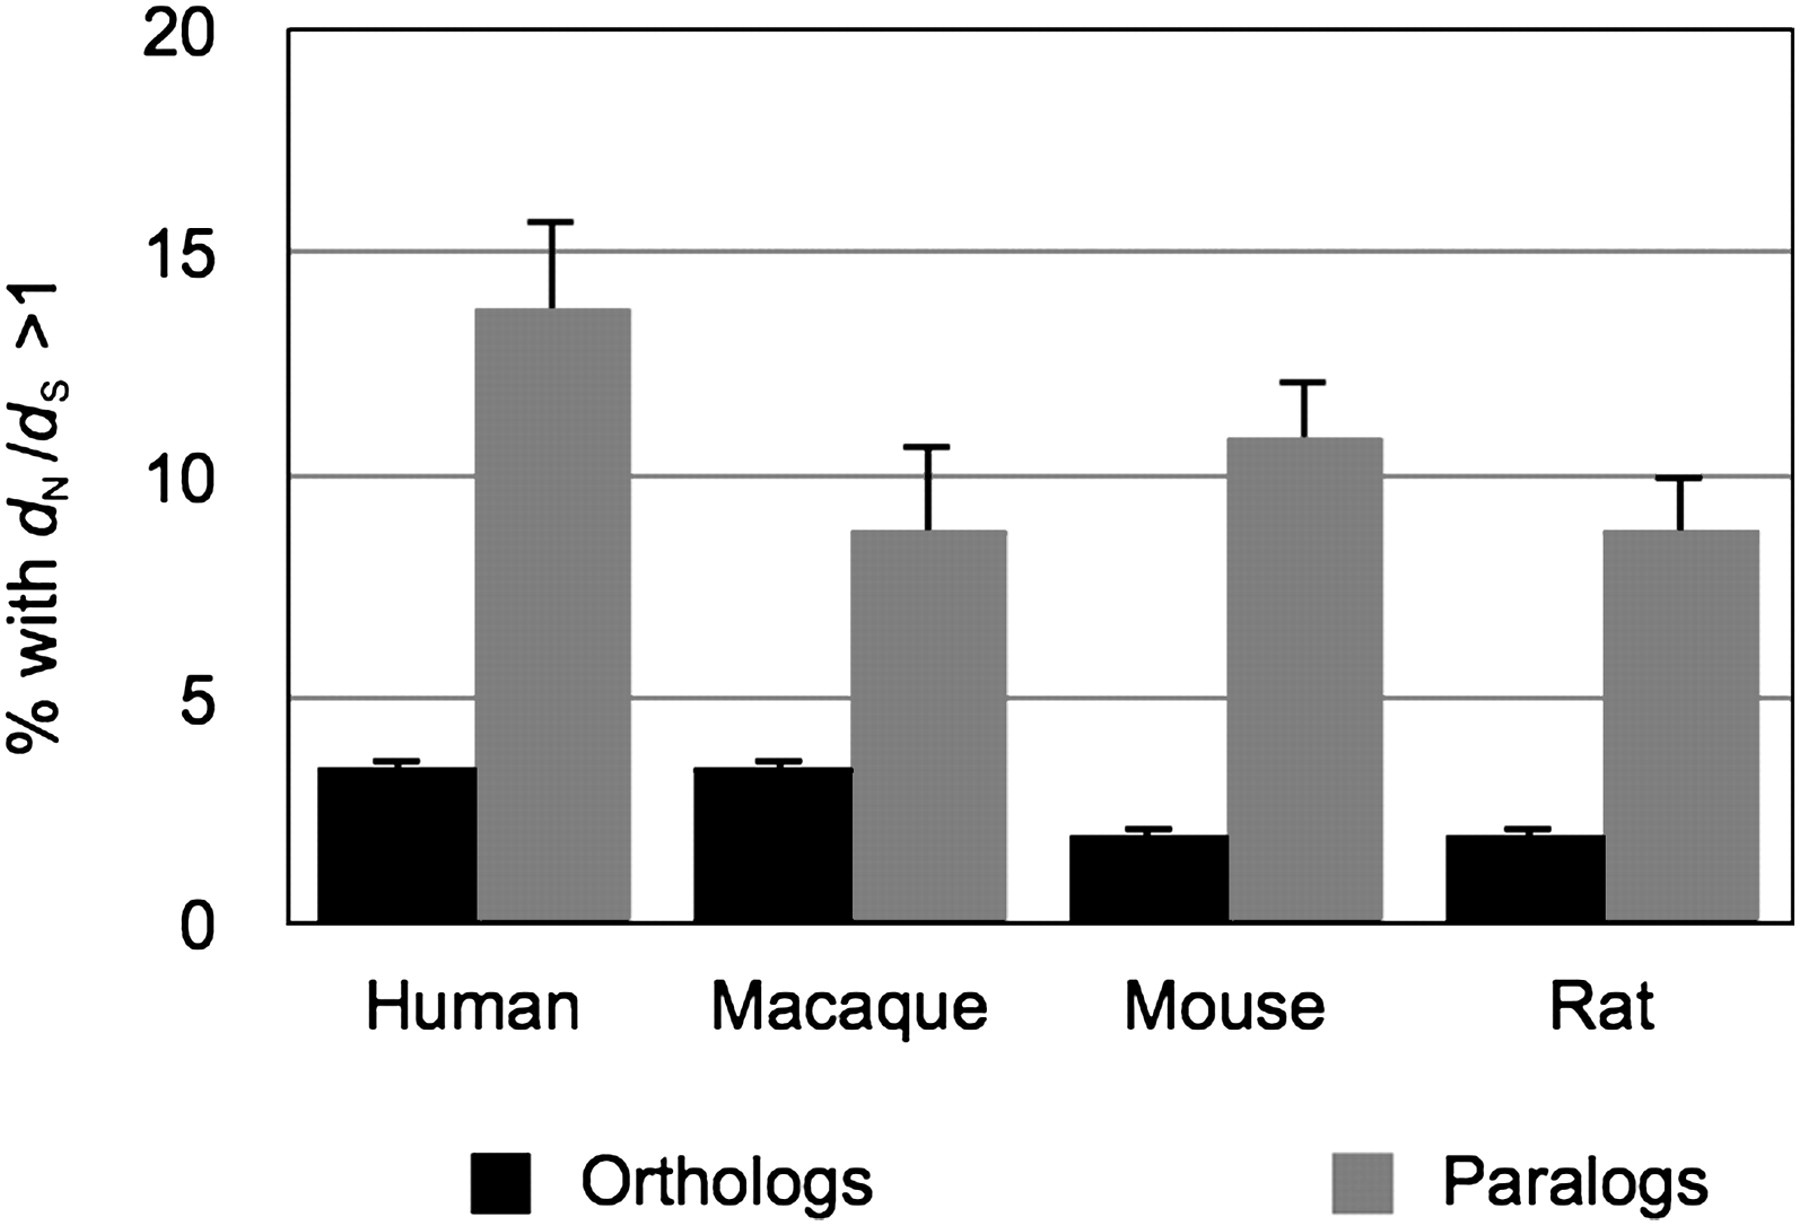
Figure 2.
Positive selection on gene duplicates. The proportion of lineage-specific subtrees and orthologs with evidence for positive selection using a likelihood ratio test between models M1a and M2a (P < 0.05). Standard errors are shown.


