
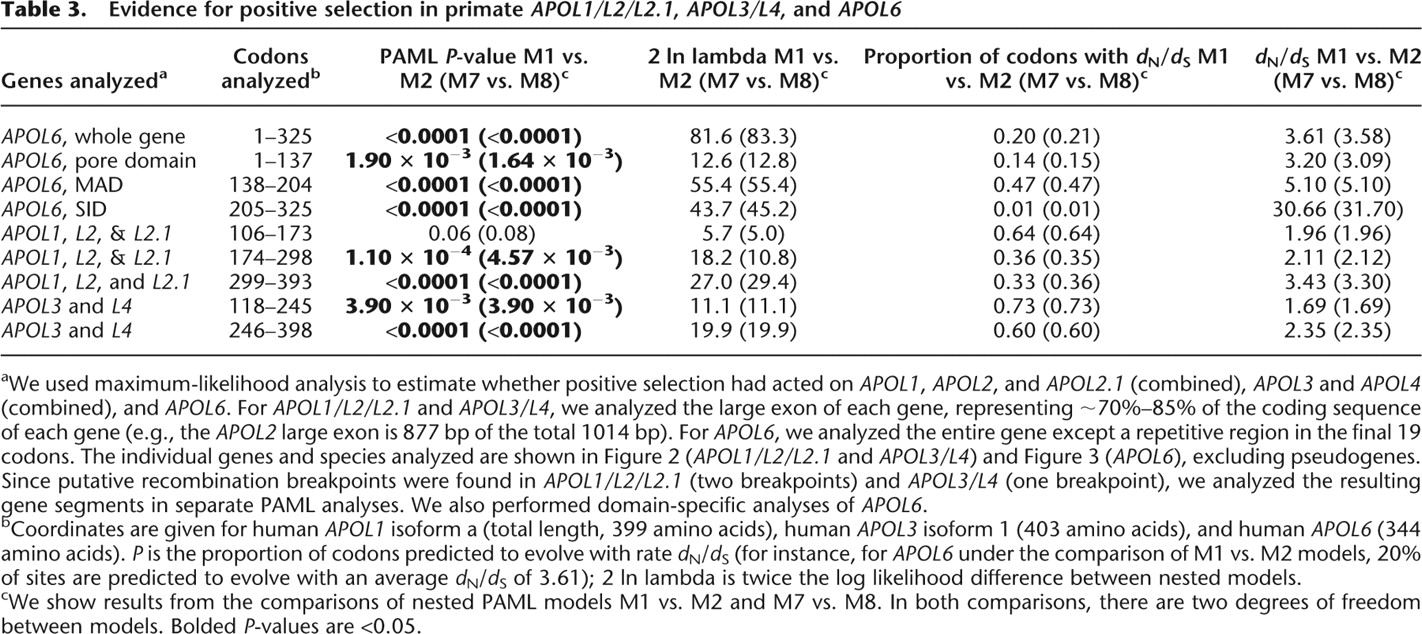
Evidence for positive selection in primate APOL1/L2/L2.1, APOL3/L4, and APOL6
Click on table to view larger version.
-
aWe used maximum-likelihood analysis to estimate whether positive selection had acted on APOL1, APOL2, and APOL2.1 (combined), APOL3 and APOL4 (combined), and APOL6. For APOL1/L2/L2.1 and APOL3/L4, we analyzed the large exon of each gene, representing ∼70%–85% of the coding sequence of each gene (e.g., the APOL2 large exon is 877 bp of the total 1014 bp). For APOL6, we analyzed the entire gene except a repetitive region in the final 19 codons. The individual genes and species analyzed are shown in Figure 2 (APOL1/L2/L2.1 and APOL3/L4) and Figure 3 (APOL6), excluding pseudogenes. Since putative recombination breakpoints were found in APOL1/L2/L2.1 (two breakpoints) and APOL3/L4 (one breakpoint), we analyzed the resulting gene segments in separate PAML analyses. We also performed domain-specific analyses of APOL6.
-
bCoordinates are given for human APOL1 isoform a (total length, 399 amino acids), human APOL3 isoform 1 (403 amino acids), and human APOL6 (344 amino acids). P is the proportion of codons predicted to evolve with rate dN/dS (for instance, for APOL6 under the comparison of M1 vs. M2 models, 20% of sites are predicted to evolve with an average dN/dS of 3.61); 2 ln lambda is twice the log likelihood difference between nested models.
-
cWe show results from the comparisons of nested PAML models M1 vs. M2 and M7 vs. M8. In both comparisons, there are two degrees of freedom between models. Bolded P-values are <0.05.


