
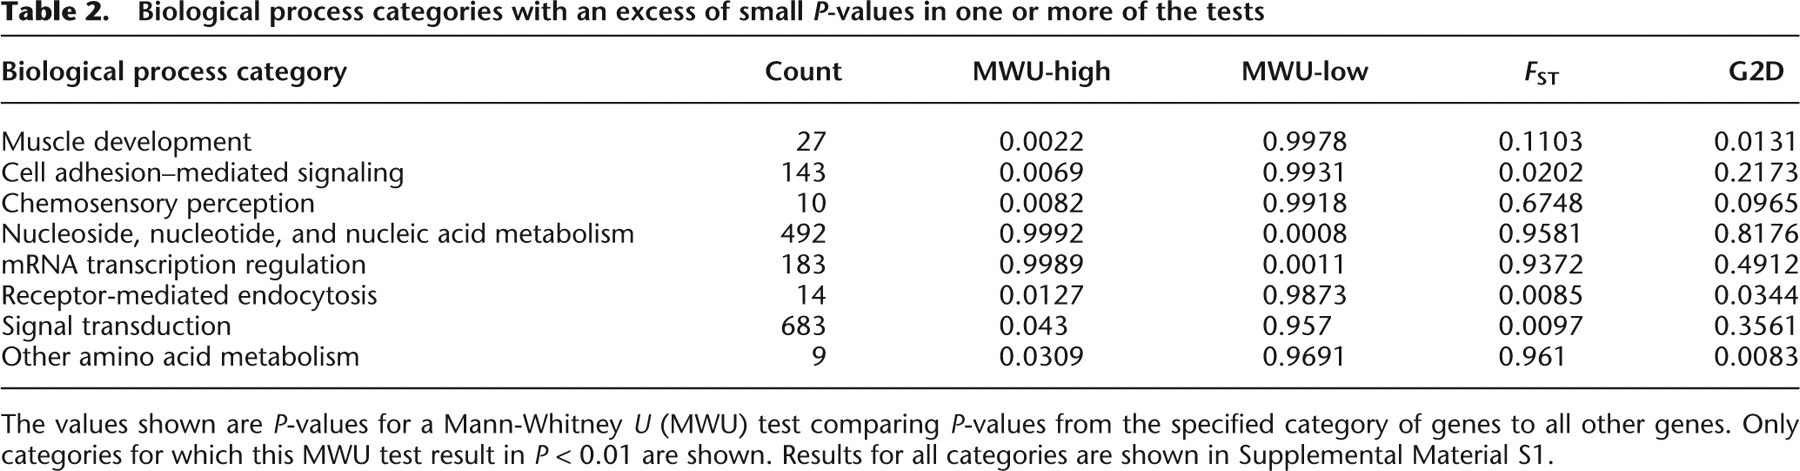
Table 2.
Biological process categories with an excess of small P-values in one or more of the tests
Click on table to view larger version.
-
The values shown are P-values for a Mann-Whitney U (MWU) test comparing P-values from the specified category of genes to all other genes. Only categories for which this MWU test result in P < 0.01 are shown. Results for all categories are shown in Supplemental Material S1.


